Integrating YaCy Grid Locally with Susper

The YaCy Grid is the second-generation implementation of YaCy, a peer-to-peer search engine.The search results can be improved to a great extent by using YaCy-Grid as the new backend for SUSPER. YaCy Grid is the best choice for distributed search topology. The legacy YaCy is made for decentralised and also distributed network. While both the networks are distributed,the YaCy-Grid is centralized and legacy YaCy is decentralized. YaCy Grid facilitates a lot with scaling that will be in our hand and can be done in all aspects​(loading, parsing, indexing) with computing power we choose. In YaCy,Solr is embedded. But in YaCy Grid,we will get elasticsearch cluster.​They are both built around the core underlying search library Lucene.But ​elasticsearch will help us to scale almost indefinitely. In this blog, I will show you how to integrate YaCy Grid with Susper locally and how to use it to fetch results.

Implementing YaCy Grid with Susper:

Before using YaCy Grid we need to first setup YaCy Grid and crawl to url using crawl start API, more information about that can be found here Implementing YaCy Grid with Susper and Setting up YaCy Grid locally.

So, once we are done with setup and crawling, we need to begin using its APIs in Susper. Following are some easy steps in which we can show results from YaCy Grid in a separate tab is Susper.

Step 1:

Creating a service to fetch results:

In order to fetch results from local YaCy Grid server we need to create a service to fetch results from local YaCy Grid server. Here is the class in grid-service.ts which fetches results for us.

export class GridSearchService {
 server = 'http://127.0.0.1:8100';
 searchURL = this.server + '/yacy/grid/mcp/index/yacysearch.json?query=';
 constructor(private http: Http,
             private jsonp: Jsonp,
             private store: Store<fromRoot.State>) {
 }
 getSearchResults(searchquery) { 
   return this.http
     .get(this.searchURL+searchquery).map(res =>
         res.json()
     ).catch(this.handleError);
 }


Step 2:

Modifying results.component.ts file

In order to get results from grid-service.ts in results.component.ts we must need to create an instance of the service and use this instance to get the results and store it in variables results.component.ts file and then use these variables to show results in results template. Following is the code that does this for us

ngOnInit() {
   this.grid.getSearchResults(this.searchdata.query).subscribe(res=>{
     this.gridResult=res.channels;
   });
 }


gridClick(){
   this.getPresentPage(1);
   this.resultDisplay = 'grid';
   this.totalgridresults=this.gridResult[0].totalResults;
   this.gridmessage='About ' + this.totalgridresults + ' results';
   this.gridItems=this.gridResult[0].items;
  
   console.log(this.gridItems);
 }


Step 3:

Creating a New tab to show results from YaCy Grid:

Now we need to create a tab in the template where we can use local variables in results.component.ts to show the results following the current design pattern here is the code for that

<li [class.active_view]="Display('grid')" (click)="gridClick()">YaCy_Grid</li>

<!--YaCy Grid-->
 <div class="container-fluid">
     <div class="result message-bar" *ngIf="totalgridresults > 0 && Display('grid')">
       {{gridmessage}}
     </div>
     <div class="autocorrect">
       <app-auto-correct [hidden]="hideAutoCorrect"></app-auto-correct>
     </div>
   </div>
 <div class="grid-result" *ngIf="Display('grid')">
   <div class="feed container">
       <div *ngFor="let item of gridItems" class="result">
         <div class="title">
           <a class="title-pointer" href="{{item.link}}" [style.color]="themeService.titleColor">{{item.title}}</a>
         </div>
         <div class="link">
           <p [style.color]="themeService.linkColor">{{item.link}}</p>
         </div>
         <div class="description">
           <p [style.color]="themeService.descriptionColor">{{item.pubDate|date:'MMMM d, yyyy'}} - {{item.description}}</p>
         </div>
       </div>
   </div>
 </div>
 <!-- END -->


Step 4:

Starting YaCy Grid Locally:

Now all we need is to start YaCy Grid server locally. To start it go in yacy_grid_mcp folder and use

python bin/start_elasticsearch.py


This will start elasticsearch from its respective script.Next use

python bin/start_rabbitmq.py


This will start RabbitMQ server with the required configuration.Next useThis will start elasticsearch from its respective script.Next use

gradle run


To start YaCy Grid locally.

Now we are all done we just need to start Susper using

ng serve


command and type a search query and move to YaCy_Grid tab to see results from YaCy Grid Server.

Here is the image which shows results from YaCy Grid in Susper

Resources

Continue ReadingIntegrating YaCy Grid Locally with Susper

Setting up YaCy Grid locally

SUSPER is a search interface that uses P2P search engine YaCy . Search results are displayed using Solr server which is embedded into YaCy. The retrieval of search results is done using YaCy search API. When a search request is made in one of the search templates, an HTTP request is made to YaCy and the response is done in JSON. In this blog post I will show how to setup YaCy Grid locally.

What is YaCy Grid ?

The YaCy Grid is the second-generation implementation of YaCy, a peer-to-peer search engine. The required storage functions of the YaCy Grid are:

  1.  An asset storage, basically a file sharing environment for YaCy components,an ftp server is used for asset storage.
  2.  A message system providing an Enterprise Integration Framework using a message-oriented middleware,RabbitMQ message queues for the message system.
  3.  A database system providing search-engine related retrieval functions.It uses Elasticsearch for database operations.

How to setup YaCy Grid locally ?

YaCy Grid have 4 components MCP(Master Connect Program), Loader, Crawler and  Parser.

  1. Clone all the components using –recursive flag.

git clone --recursive https://github.com/yacy/yacy_grid_mcp.git
git clone --recursive https://github.com/yacy/yacy_grid_parser.git
git clone --recursive https://github.com/yacy/yacy_grid_crawler.git
git clone --recursive https://github.com/yacy/yacy_grid_loader.git
  1.  Now to starting YaCy Grid requires starting Elasticsearch, RabbitMQ with Username `anonymous` and Password `yacy` and an ftp server(it can be omitted as MCP can take over).
  2.  All the above steps can also be done in a single step by running a python script in `bin` folder `run_all.py`
  3.  Working of `run_all.py` in yacy_grid_mcp:

if not checkportopen(9200):
   print "Elasticsearch is not running"
   mkapps()
   elasticversion = 'elasticsearch-5.6.5'
   if not os.path.isfile(path_apphome + '/data/mcp-8100/apps/' + elasticversion + '.tar.gz'):
       print('Downloading ' + elasticversion)
       urllib.urlretrieve ('https://artifacts.elastic.co/downloads/elasticsearch/' + elasticversion + '.tar.gz', path_apphome + '/data/mcp-8100/apps/' + elasticversion + '.tar.gz')
   if not os.path.isdir(path_apphome + '/data/mcp-8100/apps/elasticsearch'):
       print('Decompressing' + elasticversion)
       os.system('tar xfz ' + path_apphome + '/data/mcp-8100/apps/' + elasticversion + '.tar.gz -C ' + path_apphome + '/data/mcp-8100/apps/')
       os.rename(path_apphome + '/data/mcp-8100/apps/' + elasticversion, path_apphome + '/data/mcp-8100/apps/elasticsearch')
   # run elasticsearch
   print('Running Elasticsearch')
   os.chdir(path_apphome + '/data/mcp-8100/apps/elasticsearch/bin')
   os.system('nohup ./elasticsearch &')


  • Checks whether Elasticsearch is running or not, if not then runs Elasticsearch.
if checkportopen(15672):
   print "RabbitMQ is Running"
   print "If you have configured it according to YaCy setup press N"
   print "If you have not configured it according to YaCy setup or Do not know what to do press Y"
   n=raw_input()
   if(n=='Y' or n=='y'):
       os.system('service rabbitmq-server stop')
       
if not checkportopen(15672):
   print "rabbitmq is not running"
   os.system('python bin/start_rabbitmq.py')
  • Checks whether RabbitMQ is running or not, if yes then asks user to configure it according to YaCy Grid setup by pressing Y or else ignore,if not then starts RabbitMQ according to required configuration.
subprocess.call('bin/update_all.sh')
  • .Updates all the Grid components including MCP.

if not checkportopen(2121):
   print "ftp server is not Running"
  • Checks for an ftp server and prints message accordingly.

def run_mcp():
   subprocess.call(['gnome-terminal', '-e', "gradle run"])

def run_loader():
   os.system('cd ../yacy_grid_loader')
   subprocess.call(['gnome-terminal', '-e', "gradle run"])

def run_crawler():
   os.system('cd ../yacy_grid_crawler')
   subprocess.call(['gnome-terminal', '-e', "gradle run"])

def run_parser():
   os.system('cd ../yacy_grid_parser')
   subprocess.call(['gnome-terminal', '-e', "gradle run"])


  • Runs all components of YaCy Grid in separate terminal.

Once user starts it, then he can start using YaCy Grid through terminal.

If a YaCy Grid service has used the MCP once, it learns from the MCP to connect to the infrastructure itself. For example:

  • a YaCy Grid service starts up and connects to the MCP
  • the Grid service pushes a message to the message queue using the MCP
  • the MCP fulfils the message send operation and response with the actual address of the message broker
  • the YaCy Grid service learns the direct connection information
  • whenever the YaCy Grid service wants to connect to the message broker again, it can do so using a direct broker connection. This process is done transparently, the Grid service does not need to handle such communication details itself. The routing is done automatically. To use the MCP inside other grid components the git submodule functionality is used.

Resources

Continue ReadingSetting up YaCy Grid locally

Persistently Storing loklak Server Dumps on Kubernetes

In an earlier blog post, I discussed loklak setup on Kubernetes. The deployment mentioned in the post was to test the development branch. Next, we needed to have a deployment where all the messages are collected and dumped in text files that can be reused.

In this blog post, I will be discussing the challenges with such deployment and the approach to tackle them.

Volatile Disk in Kubernetes

The pods that hold deployments in Kubernetes have disk storage. Any data that gets written by the application stays only until the same version of deployment is running. As soon as the deployment is updated/relocated, the data stored during the application is cleaned up.


Due to this, dumps are written when loklak is running but they get wiped out when the deployment image is updated. In other words, all dumps are lost when the image updates. We needed to find a solution to this as we needed a permanent storage when collecting dumps.

Persistent Disk

In order to have a storage which can hold data permanently, we can mount persistent disk(s) on a pod at the appropriate location. This ensures that the data that is important to us stays with us, even
when the deployment goes down.


In order to add persistent disks, we first need to create a persistent disk. On Google Cloud Platform, we can use the gcloud CLI to create disks in a given region –

gcloud compute disks create --size=<required size> --zone=<same as cluster zone> <unique disk name>

After this, we can mount it on a Docker volume defined in Kubernetes configurations –

      ...
      volumeMounts:
        - mountPath: /path/to/mount
          name: volume-name
  volumes:
    - name: volume-name
      gcePersistentDisk:
        pdName: disk-name
        fsType: fileSystemType

But this setup can’t be used for storing loklak dumps. Let’s see “why” in the next section.

Rolling Updates and Persistent Disk

The Kubernetes deployment needs to be updated when the master branch of loklak server is updated. This update of master deployment would create a new pod and try to start loklak server on it. During all this, the older deployment would also be running and serving the requests.


The control will not be transferred to the newer pod until it is ready and all the probes are passing. The newer deployment will now try to mount the disk which is mentioned in the configuration, but it would fail to do so. This would happen because the older pod has already mounted the disk.


Therefore, all new deployments would simply fail to start due to insufficient resources. To overcome such issues, Kubernetes allows persistent volume claims. Let’s see how we used them for loklak deployment.

Persistent Volume Claims

Kubernetes provides Persistent Volume Claims which claim resources (storage) from a Persistent Volume (just like a pod does from a node). The higher level APIs are provided by Kubernetes (configurations and kubectl command line). In the loklak deployment, the persistent volume is a Google Compute Engine disk –

apiVersion: v1
kind: PersistentVolume
metadata:
  name: dump
  namespace: web
spec:
  capacity:
    storage: 100Gi
  accessModes:
    - ReadWriteOnce
  persistentVolumeReclaimPolicy: Retain
  storageClassName: slow
  gcePersistentDisk:
    pdName: "data-dump-disk"
    fsType: "ext4"

[SOURCE]

It must be noted here that a persistent disk by the name of data-dump-index is already created in the same region.


The storage class defines the way in which the PV should be handled, along with the provisioner for the service –

kind: StorageClass
apiVersion: storage.k8s.io/v1
metadata:
  name: slow
  namespace: web
provisioner: kubernetes.io/gce-pd
parameters:
  type: pd-standard
  zone: us-central1-a

[SOURCE]

After having the StorageClass and PersistentVolume, we can create a claim for the volume by using appropriate configurations –

apiVersion: v1
kind: PersistentVolumeClaim
metadata:
  name: dump
  namespace: web
spec:
  accessModes:
    - ReadWriteOnce
  resources:
    requests:
      storage: 100Gi
  storageClassName: slow

[SOURCE]

After this, we can mount this claim on our Deployment –

  ...
  volumeMounts:
    - name: dump
      mountPath: /loklak_server/data
volumes:
  - name: dump
    persistentVolumeClaim:
      claimName: dump

[SOURCE]

Verifying persistence of Dumps

To verify this, we can redeploy the cluster using the same persistent disk and check if the earlier dumps are still present there –

$ http http://link.to.deployment/dump/
HTTP/1.1 200 OK
Cache-Control: public, max-age=60
Content-Type: text/html;charset=utf-8
...


<!DOCTYPE HTML PUBLIC "-//W3C//DTD HTML 3.2 Final//EN">

<h1>Index of /dump</h1>
<pre>      Name 
[gz ] <a href="messages_20170802_71562040.txt.gz">messages_20170802_71562040.txt.gz</a>   Thu Aug 03 00:07:21 GMT 2017   132M
[gz ] <a href="messages_20170803_69925009.txt.gz">messages_20170803_69925009.txt.gz</a>   Mon Aug 07 15:40:04 GMT 2017   532M
[gz ] <a href="messages_20170807_36357603.txt.gz">messages_20170807_36357603.txt.gz</a>   Wed Aug 09 10:26:24 GMT 2017   377M
[txt] <a href="messages_20170809_27974404.txt">messages_20170809_27974404.txt</a>      Thu Aug 10 08:51:49 GMT 2017  1564M
<hr></pre>
...

Conclusion

In this blog post, I discussed the process of deployment of loklak with persistent dumps on Kubernetes. This deployment is intended to work as root.loklak.org in near future. The changes were proposed in loklak/loklak_server#1377 by @singhpratyush (me).

Resources

Continue ReadingPersistently Storing loklak Server Dumps on Kubernetes

Using Mosquitto as a Message Broker for MQTT in loklak Server

In loklak server, messages are collected from various sources and indexed using Elasticsearch. To know when a message of interest arrives, users can poll the search endpoint. But this method would require a lot of HTTP requests, most of them being redundant. Also, if a user would like to collect messages for a particular topic, he would need to make a lot of requests over a period of time to get enough data.

For GSoC 2017, my proposal was to introduce stream API in the loklak server so that we could save ourselves from making too many requests and also add many use cases.

Mosquitto is Eclipse’s project which acts as a message broker for the popular MQTT protocol. MQTT, based on the pub-sub model, is a lightweight and IOT friendly protocol. In this blog post, I will discuss the basic setup of Mosquitto in the loklak server.

Installation and Dependency for Mosquitto

The installation process of Mosquitto is very simple. For Ubuntu, it is available from the pre installed PPAs –

sudo apt-get install mosquitto

Once the message broker is up and running, we can use the clients to connect to it and publish/subscribe to channels. To add MQTT client as a project dependency, we can introduce following line in Gradle dependencies file –

compile group: 'net.sf.xenqtt', name: 'xenqtt', version: '0.9.5'

[SOURCE]

After this, we can use the client libraries in the server code base.

The MQTTPublisher Class

The MQTTPublisher class in loklak would provide an interface to perform basic operations in MQTT. The implementation uses AsyncClientListener to connect to Mosquitto broker –

AsyncClientListener listener = new AsyncClientListener() {
    // Override methods according to needs
};

[SOURCE]

The publish method for the class can be used by other components of the project to publish messages on the desired channel –

public void publish(String channel, String message) {
    this.mqttClient.publish(new PublishMessage(channel, QoS.AT_LEAST_ONCE, message));
}

[SOURCE]

We also have methods which allow publishing of multiple messages to multiple channels in order to increase the functionality of the class.

Starting Publisher with Server

The flags which signal using of streaming service in loklak are located in conf/config.properties. These configurations are referred while initializing the Data Access Object and an MQTTPublisher is created if needed –

String mqttAddress = getConfig("stream.mqtt.address", "tcp://127.0.0.1:1883");
streamEnabled = getConfig("stream.enabled", false);
if (streamEnabled) {
    mqttPublisher = new MQTTPublisher(mqttAddress);
}

[SOURCE]

The mqttPublisher can now be used by other components of loklak to publish messages to the channel they want.

Adding Mosquitto to Kubernetes

Since loklak has also a nice Kubernetes setup, it was very simple to introduce a new deployment for Mosquitto to it.

Changes in Dockerfile

The Dockerfile for master deployment has to be modified to discover Mosquitto broker in the Kubernetes cluster. For this purpose, corresponding flags in config.properties have to be changed to ensure that things work fine –

sed -i.bak 's/^\(stream.enabled\).*/\1=true/' conf/config.properties && \
sed -i.bak 's/^\(stream.mqtt.address\).*/\1=mosquitto.mqtt:1883/' conf/config.properties && \

[SOURCE]

The Mosquitto broker would be available at mosquitto.mqtt:1883 because of the service that is created for it (explained in later section).

Mosquitto Deployment

The Docker image used in Kubernetes deployment of Mosquitto is taken from toke/docker-kubernetes. Two ports are exposed for the cluster but no volumes are needed –

apiVersion: extensions/v1beta1
kind: Deployment
metadata:
  name: mosquitto
  namespace: mqtt
spec:
  ...
  template:
    ...
    spec:
      containers:
      - name: mosquitto
        image: toke/mosquitto
        ports:
        - containerPort: 9001
        - containerPort: 8883

[SOURCE]

Exposing Mosquitto to the Cluster

Now that we have the deployment running, we need to expose the required ports to the cluster so that other components may use it. The port 9001 appears as port 80 for the service and 1883 is also exposed –

apiVersion: v1
kind: Service
metadata:
  name: mosquitto
  namespace: mqtt
  ...
spec:
  ...
  ports:
  - name: mosquitto
    port: 1883
  - name: mosquitto-web
    port: 80
    targetPort: 9001

[SOURCE]

After creating the service using this configuration, we will be able to connect our clients to Mosquitto at address mosquitto.mqtt:1883.

Conclusion

In this blog post, I discussed the process of adding Mosquitto to the loklak server project. This is the first step towards introducing the stream API for messages collected in loklak.

These changes were introduced in pull requests loklak/loklak_server#1393 and loklak/loklak_server#1398 by @singhpratyush (me).

Resources

Continue ReadingUsing Mosquitto as a Message Broker for MQTT in loklak Server

Deploying loklak Server on Kubernetes with External Elasticsearch

Kubernetes is an open-source system for automating deployment, scaling, and management of containerized applications.

kubernetes.io

Kubernetes is an awesome cloud platform, which ensures that cloud applications run reliably. It runs automated tests, flawless updates, smart roll out and rollbacks, simple scaling and a lot more.

So as a part of GSoC, I worked on taking the loklak server to Kubernetes on Google Cloud Platform. In this blog post, I will be discussing the approach followed to deploy development branch of loklak on Kubernetes.

New Docker Image

Since Kubernetes deployments work on Docker images, we needed one for the loklak project. The existing image would not be up to the mark for Kubernetes as it contained the declaration of volumes and exposing of ports. So I wrote a new Docker image which could be used in Kubernetes.

The image would simply clone loklak server, build the project and trigger the server as CMD

FROM alpine:latest

ENV LANG=en_US.UTF-8
ENV JAVA_TOOL_OPTIONS=-Dfile.encoding=UTF8

WORKDIR /loklak_server

RUN apk update && apk add openjdk8 git bash && \
    git clone https://github.com/loklak/loklak_server.git /loklak_server && \
    git checkout development && \
    ./gradlew build -x test -x checkstyleTest -x checkstyleMain -x jacocoTestReport && \
    # Some Configurations and Cleanups

CMD ["bin/start.sh", "-Idn"]

[SOURCE]

This image wouldn’t have any volumes or exposed ports and we are now free to configure them in the configuration files (discussed in a later section).

Building and Pushing Docker Image using Travis

To automatically build and push on a commit to the master branch, Travis build is used. In the after_success section, a call to push Docker image is made.

Travis environment variables hold the username and password for Docker hub and are used for logging in –

docker login -u $DOCKER_USERNAME -p $DOCKER_PASSWORD

[SOURCE]

We needed checks there to ensure that we are on the right branch for the push and we are not handling a pull request –

# Build and push Kubernetes Docker image
KUBERNETES_BRANCH=loklak/loklak_server:latest-kubernetes-$TRAVIS_BRANCH
KUBERNETES_COMMIT=loklak/loklak_server:kubernetes-$TRAVIS_COMMIT
  
if [ "$TRAVIS_BRANCH" == "development" ]; then
    docker build -t loklak_server_kubernetes kubernetes/images/development
    docker tag loklak_server_kubernetes $KUBERNETES_BRANCH
    docker push $KUBERNETES_BRANCH
    docker tag $KUBERNETES_BRANCH $KUBERNETES_COMMIT
    docker push $KUBERNETES_COMMIT
elif [ "$TRAVIS_BRANCH" == "master" ]; then
    # Build and push master
else
    echo "Skipping Kubernetes image push for branch $TRAVIS_BRANCH"
fi

[SOURCE]

Kubernetes Configurations for loklak

Kubernetes cluster can completely be configured using configurations written in YAML format. The deployment of loklak uses the previously built image. Initially, the image tagged as latest-kubernetes-development is used –

apiVersion: apps/v1beta1
kind: Deployment
metadata:
  name: server
  namespace: web
spec:
  replicas: 1
  template:
    metadata:
      labels:
        app: server
    spec:
      containers:
      - name: server
        image: loklak/loklak_server:latest-kubernetes-development
        ...

[SOURCE]

Readiness and Liveness Probes

Probes act as the top level tester for the health of a deployment in Kubernetes. The probes are performed periodically to ensure that things are working fine and appropriate steps are taken if they fail.

When a new image is updated, the older pod still runs and servers the requests. It is replaced by the new ones only when the probes are successful, otherwise, the update is rolled back.

In loklak, the /api/status.json endpoint gives information about status of deployment and hence is a good target for probes –

livenessProbe:
  httpGet:
    path: /api/status.json
    port: 80
  initialDelaySeconds: 30
  timeoutSeconds: 3
readinessProbe:
  httpGet:
    path: /api/status.json
    port: 80
  initialDelaySeconds: 30
  timeoutSeconds: 3

[SOURCE]

These probes are performed periodically and the server is restarted if they fail (non-success HTTP status code or takes more than 3 seconds).

Ports and Volumes

In the configurations, port 80 is exposed as this is where Jetty serves inside loklak –

ports:
- containerPort: 80
  protocol: TCP

[SOURCE]

If we notice, this is the port that we used for running the probes. Since the development branch deployment holds no dumps, we didn’t need to specify any explicit volumes for persistence.

Load Balancer Service

While creating the configurations, a new public IP is assigned to the deployment using Google Cloud Platform’s load balancer. It starts listening on port 80 –

ports:
- containerPort: 80
  protocol: TCP

[SOURCE]

Since this service creates a new public IP, it is recommended not to replace/recreate this services as this would result in the creation of new public IP. Other components can be updated individually.

Kubernetes Configurations for Elasticsearch

To maintain a persistent index, this deployment would require an external Elasticsearch cluster. loklak is able to connect itself to external Elasticsearch cluster by changing a few configurations.

Docker Image and Environment Variables

The image used for Elasticsearch is taken from pires/docker-elasticsearch-kubernetes. It allows easy configuration of properties from environment variables in configurations. Here is a list of configurable variables, but we needed just a few of them to do our task –

image: quay.io/pires/docker-elasticsearch-kubernetes:2.0.0
env:
- name: KUBERNETES_CA_CERTIFICATE_FILE
  value: /var/run/secrets/kubernetes.io/serviceaccount/ca.crt
- name: NAMESPACE
  valueFrom:
    fieldRef:
      fieldPath: metadata.namespace
- name: "CLUSTER_NAME"
  value: "loklakcluster"
- name: "DISCOVERY_SERVICE"
  value: "elasticsearch"
- name: NODE_MASTER
  value: "true"
- name: NODE_DATA
  value: "true"
- name: HTTP_ENABLE
  value: "true"

[SOURCE]

Persistent Index using Persistent Cloud Disk

To make the index last even after the deployment is stopped, we needed a stable place where we could store all that data. Here, Google Compute Engine’s standard persistent disk was used. The disk can be created using GCP web portal or the gcloud CLI.

Before attaching the disk, we need to declare a volume where we could mount it –

volumeMounts:
- mountPath: /data
  name: storage

[SOURCE]

Now that we have a volume, we can simply mount the persistent disk on it –

volumes:
- name: storage
  gcePersistentDisk:
    pdName: data-index-disk
    fsType: ext4

[SOURCE]

Now, whenever we deploy these configurations, we can reuse the previous index.

Exposing Kubernetes to Cluster

The HTTP and transport clients are enabled on port 9200 and 9300 respectively. They can be exposed to the rest of the cluster using the following service –

apiVersion: v1
kind: Service
...
Spec:
  ...
  ports:
  - name: http
    port: 9200
    protocol: TCP
  - name: transport
    port: 9300
    protocol: TCP

[SOURCE]

Once deployed, other deployments can access the cluster API from ports 9200 and 9300.

Connecting loklak to Kubernetes

To connect loklak to external Elasticsearch cluster, TransportClient Java API is used. In order to enable these settings, we simply need to make some changes in configurations.

Since we enable the service named “elasticsearch” in namespace “elasticsearch”, we can access the cluster at address elasticsearch.elasticsearch:9200 (web) and elasticsearch.elasticsearch:9300 (transport).

To confine these changes only to Kubernetes deployment, we can use sed command while building the image (in Dockerfile) –

sed -i.bak 's/^\(elasticsearch_transport.enabled\).*/\1=true/' conf/config.properties && \
sed -i.bak 's/^\(elasticsearch_transport.addresses\).*/\1=elasticsearch.elasticsearch:9300/' conf/config.properties && \

[SOURCE]

Now when we create the deployments in Kubernetes cluster, loklak auto connects to the external elasticsearch index and creates indices if needed.

Verifying persistence of the Elasticsearch Index

In order to see that the data persists, we can completely delete the deployment or even the cluster if we want. Later, when we recreate the deployment, we can see all the messages already present in the index.

I  [2017-07-29 09:42:51,804][INFO ][node                     ] [Hellion] initializing ...
 
I  [2017-07-29 09:42:52,024][INFO ][plugins                  ] [Hellion] loaded [cloud-kubernetes], sites []
 
I  [2017-07-29 09:42:52,055][INFO ][env                      ] [Hellion] using [1] data paths, mounts [[/data (/dev/sdb)]], net usable_space [84.9gb], net total_space [97.9gb], spins? [possibly], types [ext4]
 
I  [2017-07-29 09:42:53,543][INFO ][node                     ] [Hellion] initialized
 
I  [2017-07-29 09:42:53,543][INFO ][node                     ] [Hellion] starting ...
 
I  [2017-07-29 09:42:53,620][INFO ][transport                ] [Hellion] publish_address {10.8.1.13:9300}, bound_addresses {10.8.1.13:9300}
 
I  [2017-07-29 09:42:53,633][INFO ][discovery                ] [Hellion] loklakcluster/cJtXERHETKutq7nujluJvA
 
I  [2017-07-29 09:42:57,866][INFO ][cluster.service          ] [Hellion] new_master {Hellion}{cJtXERHETKutq7nujluJvA}{10.8.1.13}{10.8.1.13:9300}{master=true}, reason: zen-disco-join(elected_as_master, [0] joins received)
 
I  [2017-07-29 09:42:57,955][INFO ][http                     ] [Hellion] publish_address {10.8.1.13:9200}, bound_addresses {10.8.1.13:9200}
 
I  [2017-07-29 09:42:57,955][INFO ][node                     ] [Hellion] started
 
I  [2017-07-29 09:42:58,082][INFO ][gateway                  ] [Hellion] recovered [8] indices into cluster_state

In the last line from the logs, we can see that indices already present on the disk were recovered. Now if we head to the public IP assigned to the cluster, we can see that the message count is restored.

Conclusion

In this blog post, I discussed how we utilised the Kubernetes setup to shift loklak to Google Cloud Platform. The deployment is active and can be accessed from the link provided under wiki section of loklak/loklak_server repo.

I introduced these changes in pull request loklak/loklak_server#1349 with the help of @niranjan94, @uday96 and @chiragw15.

Resources

Continue ReadingDeploying loklak Server on Kubernetes with External Elasticsearch

Caching Elasticsearch Aggregation Results in loklak Server

To provide aggregated data for various classifiers, loklak uses Elasticsearch aggregations. Aggregated data speaks a lot more than a few instances from it can say. But performing aggregations on each request can be very resource consuming. So we needed to come up with a way to reduce this load.

In this post, I will be discussing how I came up with a caching model for the aggregated data from the Elasticsearch index.

Fields to Consider while Caching

At the classifier endpoint, aggregations can be requested based on the following fields –

  • Classifier Name
  • Classifier Classes
  • Countries
  • Start Date
  • End Date

But to cache results, we can ignore cases where we just require a few classes or countries and store aggregations for all of them instead. So the fields that will define the cache to look for will be –

  • Classifier Name
  • Start Date
  • End Date

Type of Cache

The data structure used for caching was Java’s HashMap. It would be used to map a special string key to a special object discussed in a later section.

Key

The key is built using the fields mentioned previously –

private static String getKey(String index, String classifier, String sinceDate, String untilDate) {
    return index + "::::"
        + classifier + "::::"
        + (sinceDate == null ? "" : sinceDate) + "::::"
        + (untilDate == null ? "" : untilDate);
}

[SOURCE]

In this way, we can handle requests where a user makes a request for every class there is without running the expensive aggregation job every time. This is because the key for such requests will be same as we are not considering country and class for this purpose.

Value

The object used as key in the HashMap is a wrapper containing the following –

  1. json – It is a JSONObject containing the actual data.
  2. expiry – It is the expiry of the object in milliseconds.

class JSONObjectWrapper {
    private JSONObject json; 
    private long expiry;
    ... 
}

Timeout

The timeout associated with a cache is defined in the configuration file of the project as “classifierservlet.cache.timeout”. It defaults to 5 minutes and is used to set the eexpiryof a cached JSONObject –

class JSONObjectWrapper {
    ...
    private static long timeout = DAO.getConfig("classifierservlet.cache.timeout", 300000);

    JSONObjectWrapper(JSONObject json) {
        this.json = json;
        this.expiry = System.currentTimeMillis() + timeout;
    }
    ...
}


Cache Hit

For searching in the cache, the previously mentioned string is composed from the parameters requested by the user. Checking for a cache hit can be done in the following manner –

String key = getKey(index, classifier, sinceDate, untilDate);
if (cacheMap.keySet().contains(key)) {
    JSONObjectWrapper jw = cacheMap.get(key);
    if (!jw.isExpired()) {
        // Do something with jw
    }
}
// Calculate the aggregations
...

But since jw here would contain all the data, we would need to filter out the classes and countries which are not needed.

Filtering results

For filtering out the parts which do not contain the information requested by the user, we can perform a simple pass and exclude the results that are not needed.

Since the number of fields to filter out, i.e. classes and countries, would not be that high, this process would not be that resource intensive. And at the same time, would save us from requesting heavy aggregation tasks from the user.

Since the data about classes is nested inside the respective country field, we need to perform two level of filtering –

JSONObject retJson = new JSONObject(true);
for (String key : json.keySet()) {
    JSONArray value = filterInnerClasses(json.getJSONArray(key), classes);
    if ("GLOBAL".equals(key) || countries.contains(key)) {
        retJson.put(key, value);
    }
}

Cache Miss

In the case of a cache miss, the helper functions are called from ElasticsearchClient.java to get results. These results are then parsed from HashMap to JSONObject and stored in the cache for future usages.

JSONObject freshCache = getFromElasticsearch(index, classifier, sinceDate, untilDate);
cacheMap.put(key, new JSONObjectWrapper(freshCache));

The getFromElasticsearch method finds all the possible classes and makes a request to the appropriate method in ElasticsearchClient, getting data for all classifiers and all countries.

Conclusion

In this blog post, I discussed the need for caching of aggregations and the way it is achieved in the loklak server. This feature was introduced in pull request loklak/loklak_server#1333 by @singhpratyush (me).

Resources

Continue ReadingCaching Elasticsearch Aggregation Results in loklak Server

Adding tip to drop downs in Susper using CSS in Angular

To create simple drop downs using twitter bootstrap, it is fairly easy for developers. The issue faced in Susper, however, was to add a tip on the top over such dropdowns similar to Google:

This is how it looks finally, in Susper, with a tip over the standard rectangular drop-down:

This is how it was done:

  1. First, make sure you have designed your drop-down according to your requirements, added the desired height, width and padding. These were the specifications used in Susper’s drop-down.

.dropdown-menu{
height: 500px;
width: 327px;
padding: 28px;
}
  1. Next add the following code to your drop-down class css:

.dropdown-menu:before {
position: absolute;
top: -7px;
right: 19px;
display: inlineblock;
border-right: 7px solid transparent;
border-bottom: 7px solid #ccc;
border-left: 7px solid transparent;
border-bottom-color: rgba(0, 0, 0, 0.2);
content: ;
}
.dropdown-menu:after {
position: absolute;
top: -5px;
right: 20px;
display: inlineblock;
border-right: 6px solid transparent;
border-bottom: 6px solid #ffffff;
border-left: 6px solid transparent;
content: ;
}

In css, :before inserts the style before any other html, whereas :after inserts the style after the html is loaded. Some of the parameters are explained here:

  • Top: can be used to change the position of the menu tip vertically, according to the position of your button and menu.
  • Right: can be used to change the position of the menu tip horizontally, so that it can be positioned used below the menu icon.
  • Position : absolute is used to make sure all our values are absolute and not relative to the higher div hierarchically
  • Border: All border attributes are used to specify border thickness, color and transparency before and after, which collectively gives the effect of a tip for the drop down.
  • Content : This value is set to a blank string ‘’, because otherwise none of our changes will be visible, since the divs will have no space allocated to them.

Resources

Continue ReadingAdding tip to drop downs in Susper using CSS in Angular

Implementation of Customizable Instant Search on Susper using Local Storage

Results on Susper could be instantly displayed as user types in a query. This was a strict feature till some time before, where the user doesn’t have customizable option to choose. But now one could turn off and on this feature.

To turn on and off this feature visit ‘Search Settings’ on Susper. This will be the link to it: http://susper.com/preferences and you will find different options to choose from.

How did we implement this feature?

Searchsettings.component.html:

<div>
 <h4><strong>Susper Instant Predictions</strong></h4>
 <p>When should we show you results as you type?</p>
 <input name="options" [(ngModel)]="instantresults" disabled value="#" type="radio" id="op1"><label for="op1">Only when my computer is fast enough</label><br>
 <input name="options" [(ngModel)]="instantresults" [value]="true" type="radio" id="op2"><label for="op2">Always show instant results</label><br>
 <input name="options" [(ngModel)]="instantresults" [value]="false" type="radio" id="op3"><label for="op3">Never show instant results</label><br>
</div>

User is displayed with options to choose from regarding instant search.when the user selects a new option, his selection is stored in the instantresults variable in search settings component using ngModel.

Searchsettings.component.ts:

Later when user clicks on save button the instantresults object is stored into localStorage of the browser

onSave() {
 if (this.instantresults) {
   localStorage.setItem('instantsearch', JSON.stringify({value: true}));
 } else {
   localStorage.setItem('instantsearch', JSON.stringify({ value: false }));
   localStorage.setItem('resultscount', JSON.stringify({ value: this.resultCount }));
 }
 this.router.navigate(['/']);
}


Later this value is retrieved from the localStorage function whenever a user enters a query in search bar component and search is made according to user’s preference.

Searchbar.component.ts

Later this value is retrieved from the localStorage function whenever a user enters a query in search bar component and search is made according to user’s preference.

onquery(event: any) {
 this.store.dispatch(new query.QueryAction(event));
 let instantsearch = JSON.parse(localStorage.getItem('instantsearch'));

 if (instantsearch && instantsearch.value) {
   this.store.dispatch(new queryactions.QueryServerAction({'query': event, start: this.searchdata.start, rows: this.searchdata.rows}));
   this.displayStatus = 'showbox';
   this.hidebox(event);
 } else {
   if (event.which === 13) {
     this.store.dispatch(new queryactions.QueryServerAction({'query': event, start: this.searchdata.start, rows: this.searchdata.rows}));
     this.displayStatus = 'showbox';
     this.hidebox(event);
   }
 }
}


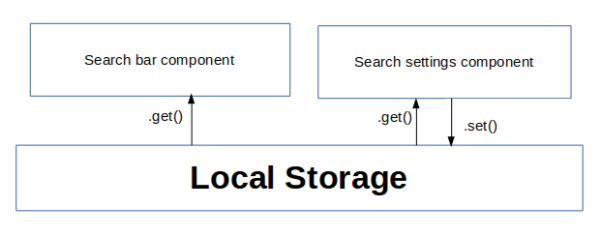
Interaction of different components here:

  1. First we set the instantresults object in Local Storage from search settings component.
  2. Later this value is retrieved and used by search bar component using localstorage.get() method to decide whether to display results instantly or not.

Below, Gif shows how you could use this feature in Susper to customise the instant results in your browser.

References:


Continue ReadingImplementation of Customizable Instant Search on Susper using Local Storage

Using Hidden Attribute for Angular in Susper

In Angular, we can use the hidden attribute, to hide and show different components of the page. This blog explains what the hidden attribute is, how it works and how to use it for some common tasks.
In Susper, we used the [hidden] attribute for two kinds of tasks.

  1. To hide components of the page until all the search results load.
  2. To hide components of the page, if they were meant to appear only in particular cases (say only the first page of the search results etc).

Let us now see how we apply this in a html file.
Use the [hidden] attribute for the component, to specify a flag variable responsible for hiding it.
When this variable is set to true or 1, the component is hidden otherwise it is shown.
Here is an example of how the [hidden] attribute is used:

<app-infobox [hidden]=”hidefooter class=“infobox col-md-4” *ngIf=“Display(‘all’)”></app-infobox>

Note that [hidden] in a way simply sets the css of the component as { display: none }, whereas in *ngIf, the component is not loaded in the DOM.
So, in this case unless Display(‘all’) returns true the component is not even loaded to the DOM but if [hidden] is set to true, then the component is still present, only not displayed.
In the typescript files, here is how the two tasks are performed:
To hide components of the page, until all the search results load.

this.querychange$ = store.select(fromRoot.getquery);
this.querychange$.subscribe(res => {
this.hidefooter = 1;

this.responseTime$ = store.select(fromRoot.getResponseTime);
this.responseTime$.subscribe(responsetime => {
this.hidefooter = 0;

The component is hidden when the query request is just sent. It is then kept hidden until the results for the previously sent query are available.

2. To hide components of the page, if they were meant to appear only in particular cases.
For example, if you wish to show a component like Autocorrect only when you are on the first page of the search results, here is how you can do it:

if (this.presentPage === 1) {
this.hideAutoCorrect = 0;
} else {
this.hideAutoCorrect = 1;
}

This should hopefully give you a good idea on how to use the hidden attribute. These resources can be referred to for more information.

Continue ReadingUsing Hidden Attribute for Angular in Susper

Crawl Job Feature For Susper To Index Websites

The Yacy backend provides search results for Susper using a web crawler (or) spider to crawl and index data from the internet. They also require some minimum input from the user.

As stated by Michael Christen (@Orbiter) “a web index is created by loading a lot of web pages first, then parsing the content and placing the result into a search index. The question is: how to get a large list of URLs? This is solved by a crawler: we start with a single web page, extract all links, then load these links and go on. The root of such a process is the ‘Crawl Start’.”

Yacy has a web crawler module that can be accessed from here: http://yacy.searchlab.eu/CrawlStartExpert.html. As we would like to have a fully supported front end for Yacy, we also introduced a crawler in Susper. Using crawler one could tell Yacy what process to do and how to crawl a URL to index search results on Yacy server. To support the indexing of web pages with the help of Yacy server, we had implemented a ‘Crawl Job’ feature in Susper.

1)Visit http://susper.com/crawlstartexpert and give information regarding the sites you want Susper to crawl.Currently, the crawler accepts an input of URLs or a file containing URLs. You could customise crawling process by tweaking crawl parameters like crawling depth, maximum pages per domain, filters, excluding media etc.

2) Once crawl parameters are set, click on ‘Start New Crawl Job’ to start the crawling process.

3) It will raise a basic authentication pop-up. After filling, the user will receive a success alert and will be redirected back to home page.

The process of crawl job on Yacy server will get started according to crawling parameters.

Implementation of Crawler on Susper:

We have created a separate component and service in Susper for Crawler

Source code can be found at:

When the user initiates the crawl job by pressing the start button, it calls startCrawlJob() function from the component and this indeed calls the CrawlStart service.We send crawlvalues to the service and subscribe, to the return object confirming whether the crawl job has started or not.

crawlstart.component.ts:-

startCrawlJob() {
 this.crawlstartservice.startCrawlJob(this.crawlvalues).subscribe(res => {
   alert('Started Crawl Job');
   this.router.navigate(['/']);
 }, (err) => {
   if (err === 'Unauthorized') {
     alert("Authentication Error");
   }
 });
};


After calling startCrawlJob() function from the service file, the service file creates a URLSearchParams object to create parameters for each key in input and send it to Yacy server through JSONP request.

crawlstart.service.ts

startCrawlJob(crawlvalues) {
 let params = new URLSearchParams();
 for (let key in crawlvalues) {
   if (crawlvalues.hasOwnProperty(key)) {
     params.set(key, crawlvalues[key]);
   }

 }
 params.set('callback', 'JSONP_CALLBACK');


 let options = new RequestOptions({ search: params });
 return this.jsonp
   .get('http://yacy.searchlab.eu/Crawler_p.json', options).map(res => {
     res.json();
   });

}

Resources:

Continue ReadingCrawl Job Feature For Susper To Index Websites