User Guide for the PSLab Remote-Access Framework

The remote-lab framework of the pocket science lab has been designed to enable user to access their devices remotely via the internet. The pslab-remote repository includes an API server built with Python-Flask and a webapp that uses EmberJS. This post is a guide for users who wish to test the framework. A series of blog posts have been previously written which have explored and elaborated various aspect of the remote-lab such as designing the API server, remote execution of function strings, automatic deployment on various domains etc. In this post, we shall explore how to execute function strings, execute example scripts, and write a script ourselves.

A live demo is hosted at pslab-remote.surge.sh . The API server is hosted at pslab-stage.herokuapp.com, and an API reference which is being developed can be accessed at pslab-stage.herokuapp.com/apidocs . A screencast of the remote lab is also available

Create an account

Signing up at this point is very straightforward, and does not include any third party verification tools since the framework is under active development, and cannot be claimed to be ready for release yet.

Click on the sign-up button, and provide a username, email, and password. The e-mail will be used as the login-id, and needs to be unique.

Login to the remote lab

Use the email-id used for signing up, enter the password, and the app will redirect you to your new home-page, where you will be greeted with a similar screen.

Your home-page

On the home-page, you will find that the first section includes a text box for entering a function string, and an execute button. Here, you can enter any valid PSLab function such as `get_resistance()` , and click on the execute button in order to run the function on the PSLab device connected to the API server, and view the results. A detailed blog post on this process can be found here.

Since this is a new account, no saved scripts are present in the Your Scripts section. We will come to that shortly, but for now, there are some pre-written example scripts that will let you test them as well as view their source code in order to copy into your own collection, and modify them.

Click on the play icon next to `multimeter.py` in order to run the script. The eye icon to the right of the row enables you to view the source code, but this can also be done while the app is running. The multimeter app looks something like this, and you can click on the various buttons to try them out.

You may also click on the Source Code tab in order to view the source

Create and execute a small python script

We can now try to create a simple script of our own. Click on the `New Python Script` button in the top-bar to navigate to a page that will allow you to create and save your own scripts. We shall write a small 3-line code to print some sinusoidal coordinates, save it, and test it. Copy the following code for a sine wave with 30 points, and publish your script.

import numpy as np
x=np.linspace(0,2*np.pi,30)
print (x, np.sin(x))

Create a button widget and associate a callback to the get_voltage function

A small degree of object oriented capabilities have also been added, and the pslab-remote allows you to create button widgets and associate their targets with other widgets and labels.
The multimeter demo script uses this feature, and a single line of code suffices to demonstrate this feature.

button('Voltage on CH1 >',"get_voltage('CH1')","display_number")

You can copy the above line into a new script in order to try it out.

Associate a button’s callback to the capture routines, and set the target as a plot

The callback target for a button can be set to point to a plot. This is useful if the callback involves arrays such as those returned by the capture routines.

Example code to show a sine wave in a plot, and make button which will replace it with captured data from the oscilloscope:

import numpy as np
x=np.linspace(0,2*np.pi,30)
plt = plot(x, np.sin(x))
button('capture 1',"capture1('CH1',100,10)","update-plot",target=plt)
Figure: Demo animation from the plot_test example. Capture1 is connected to the plot shown.
Resources
Continue ReadingUser Guide for the PSLab Remote-Access Framework

Markdown Support for Experiment Docs in PSLab Android

The PSLab Android App and the PSLab Desktop App come with built-in experiments which include the experiment setups as well as the experiment docs. The experiment docs for PSLab have been written in the Markdown format. So, the markdown support had to be enabled in the PSLab Android App.

There are numerous markdown file renderers for android. The most popular among them is MarkdownView (https://github.com/falnatsheh/MarkdownView) which is an  open-source service.

This blog covers how to enable the support for markdown in apps and use to generate elegant documentation.

Enabling MarkdownView

MarkdownView can be enabled by simply adding a dependency in the build.gradle file

compile 'us.feras.mdv:markdownview:1.1.0'


Creating the layout file

The layout file for supporting a markdown file is fairly simple. The inclusion of the above dependency simplifies the things. The view holder for markdown is created and an id is assigned to it.

<?xml version="1.0" encoding="utf-8"?>
<LinearLayout
   xmlns:android="http://schemas.android.com/apk/res/android"
   xmlns:app="http://schemas.android.com/apk/res-auto"
   android:orientation="vertical"
   android:layout_width="match_parent"
   android:layout_height="match_parent">

   <br.tiagohm.markdownview.MarkdownView
       android:layout_width="match_parent"
       app:escapeHtml="false"
       android:layout_height="match_parent"
       android:id="@+id/perform_experiment_md" />
</LinearLayout>


Loading the markdown file

In order to load the markdown file, a MarkdownView object is created. Since, in the PSLab Android app, markdown files which form the documentation part are a part of the experiments. So, the files are displayed in the documentation fragment of the experiments.

private String mdFile;
private MarkdownView mMarkdownView;

public static ExperimentDocFragment newInstance(String mdFile) {
   ExperimentDocFragment experimentDocFragment = new ExperimentDocFragment();
   experimentDocFragment.mdFile = mdFile;
   return experimentDocFragment;
}


The MarkdownView object created is assigned to markdown viewholder of the relevant layout file. Here, the layout file was named experiment_doc_md and the view holder was assigned the id perform_experiment_md. The markdown files were stored in the assets directory of the app and the files were loaded from the there.

public View onCreateView(LayoutInflater inflater, @Nullable ViewGroup container, @Nullable Bundle savedInstanceState) {
   View view = inflater.inflate(R.layout.experiment_doc_md, container, false);
   mMarkdownView = (MarkdownView) view.findViewById(R.id.perform_experiment_md);
   mMarkdownView.loadMarkdownFromAsset("capacitance.md");
   return view;
}


The available methods in markdown view are

  • loadMarkdown – loads directly from the content in the string 

mMarkdownView.loadMarkdown("**MarkdownView**");


  • loadMarkdownFromAsset – loads markdown files located in the assets directory of the app

mMarkdownView.loadMarkdownFromAsset("markdown1.md");


  • loadMarkdownFromFile – loads markdown from a file stored in the app not present in the assets directory

mMarkdownView.loadMarkdownFromFile(new File());


  • loadMarkdownFromUrl – loads markdown from the specified URL (requires internet connection, as file is loaded from the web)

mMarkdownView.loadMarkdownFromUrl("url");


Important points for consideration

  • Avoid using elements of GitHub Flavoured Markdown (GFM) as it is not fully supported. It is better to stick to the traditional markdown style.
  • While adding images in the markdown files, avoid using specific dimensions as the images may not load properly in some cases due to the wide variety of screen sizes in android devices.
  • It is better to store the Markdown files to be loaded in the assets directory of the app and load it from there instead of the other methods mentioned above.

References

  1. A comprehensive markdown tutorial to learn markdown scripting https://www.markdowntutorial.com/
  2. MarkdownView repository on Github by tiagohm https://github.com/tiagohm/MarkdownView
  3. Learn more about Github Flavoured Markdown (GFM) https://guides.github.com/features/mastering-markdown/
Continue ReadingMarkdown Support for Experiment Docs in PSLab Android

Automatic Signing and Publishing of Android Apps from Travis

As I discussed about preparing the apps in Play Store for automatic deployment and Google App Signing in previous blogs, in this blog, I’ll talk about how to use Travis Ci to automatically sign and publish the apps using fastlane, as well as how to upload sensitive information like signing keys and publishing JSON to the Open Source repository. This method will be used to publish the following Android Apps:

Current Project Structure

The example project I have used to set up the process has the following structure:

It’s a normal Android Project with some .travis.yml and some additional bash scripts in scripts folder. The update-apk.sh file is standard app build and repo push file found in FOSSASIA projects. The process used to develop it is documented in previous blogs. First, we’ll see how to upload our keys to the repo after encrypting them.

Encrypting keys using Travis

Travis provides a very nice documentation on encrypting files containing sensitive information, but a crucial information is buried below the page. As you’d normally want to upload two things to the repo – the app signing key, and API JSON file for release manager API of Google Play for Fastlane, you can’t do it separately by using standard file encryption command for travis as it will override the previous encrypted file’s secret. In order to do so, you need to create a tarball of all the files that need to be encrypted and encrypt that tar instead. Along with this, before you need to use the file, you’ll have to decrypt in in the travis build and also uncompress it for use.

So, first install Travis CLI tool and login using travis login (You should have right access to the repo and Travis CI in order to encrypt the files for it)

Then add the signing key and fastlane json in the scripts folder. Let’s assume the names of the files are key.jks and fastlane.json

Then, go to scripts folder and run this command to create a tar of these files:

tar cvf secrets.tar fastlane.json key.jks


secrets.tar will be created in the folder. Now, run this command to encrypt the file

travis encrypt-file secrets.tar


A new file secrets.tar.enc will be created in the folder. Now delete the original files and secrets tar so they do not get added to the repo by mistake. The output log will show the the command for decryption of the file to be added to the .travis.yml file.

Decrypting keys using Travis

But if we add it there, the keys will be decrypted for each commit on each branch. We want it to happen only for master branch as we only require publishing from that branch. So, we’ll create a bash script prep-key.sh for the task with following content

#!/bin/sh
set -e

export DEPLOY_BRANCH=${DEPLOY_BRANCH:-master}

if [ "$TRAVIS_PULL_REQUEST" != "false" -o "$TRAVIS_REPO_SLUG" != "iamareebjamal/android-test-fastlane" -o "$TRAVIS_BRANCH" != "$DEPLOY_BRANCH" ]; then
    echo "We decrypt key only for pushes to the master branch and not PRs. So, skip."
    exit 0
fi

openssl aes-256-cbc -K $encrypted_4dd7_key -iv $encrypted_4dd7_iv -in ./scripts/secrets.tar.enc -out ./scripts/secrets.tar -d
tar xvf ./scripts/secrets.tar -C scripts/


Of course, you’ll have to change the commands and arguments according to your need and repo. Specially, the decryption command keys ID

The script checks if the repo and branch are correct, and the commit is not of a PR, then decrypts the file and extracts them in appropriate directory

Before signing the app, you’ll need to store the keystore password, alias and key password in Travis Environment Variables. Once you have done that, you can proceed to signing the app. I’ll assume the variable names to be $STORE_PASS, $ALIAS and $KEY_PASS respectively

Signing App

Now, come to the part in upload-apk.sh script where you have the unsigned release app built. Let’s assume its name is app-release-unsigned.apk.Then run this command to sign it

cp app-release-unsigned.apk app-release-unaligned.apk
jarsigner -verbose -tsa http://timestamp.comodoca.com/rfc3161 -sigalg SHA1withRSA -digestalg SHA1 -keystore ../scripts/key.jks -storepass $STORE_PASS -keypass $KEY_PASS app-release-unaligned.apk $ALIAS


Then run this command to zipalign the app

${ANDROID_HOME}/build-tools/25.0.2/zipalign -v -p 4 app-release-unaligned.apk app-release.apk


Remember that the build tools version should be the same as the one specified in .travis.yml

This will create an apk named app-release.apk

Publishing App

This is the easiest step. First install fastlane using this command

gem install fastlane


Then run this command to publish the app to alpha channel on Play Store

fastlane supply --apk app-release.apk --track alpha --json_key ../scripts/fastlane.json --package_name com.iamareebjamal.fastlane


You can always configure the arguments according to your need. Also notice that you have to provide the package name for Fastlane to know which app to update. This can also be stored as an environment variable.

This is all for this blog, you can read more about travis CLI, fastlane features and signing process in these links below:

Continue ReadingAutomatic Signing and Publishing of Android Apps from Travis

Controlling Motors using PSLab Device

PSLab device is capable of building up a complete science lab almost anywhere. While the privilege is mostly taken by high school students and teachers to perform scientific experiments, electronic hobbyists can greatly be influenced from the device. One of the usages is to test and debug sensors and other electronic components before actually using them in their projects. In this blog it will be explained how hobbyist motors are made functional with the use of the PSLab device.

There are four types of motors generally used by hobbyists in their DIY(Do-It-Yourself) projects. They are;

  • DC Gear Motor
  • DC Brushless Motor
  • Servo Motor
  • Stepper Motor

DC motors do not require much of a control as their internal structure is simply a magnet and a shaft which was made rotatable around the magnetic field. The following image from slideshare illustrates the cross section of a motor. These motors require high currents and PSLab device as it is powered from a USB port from a PC or a mobile phone, cannot provide such high current. Hence these type of motors are not recommended to use with the device as there is a very high probability it might burn something.

In the current context, we are concerned about stepper motors and servo motors. They cannot be powered up using direct currents to them. Inside these motors, the structure is different and they require a set of controlled signals to function. The following diagram from electronics-tutorials illustrates the feedback loop inside a servo motor. A servo motor is functional using a PWM wave. Depending on the duty cycle, the rotational angle will be determined. PSLab device is capable of generating four different square waves at any duty cycle varying from 0% to 100%. This gives us freedom to acquire any angle we desire from a servo motor. The experiment “Servo Motors” implement the following method where it accepts four angles.

public void servo4(double angle1, double angle2, double angle3, double angle4)

The experiment supports control of four different servo motors at independant angles. Most of the servos available in the market support only 180 degree rotation where some servos can rotate indefinitely. In such a case, the servo will rotate one cycle and reach its initial position.

The last type of motor is stepper motor. As the name says it, this motor can produce steps. Inside of the motor, there are four coils and and five wires coming out of the motor body connecting these coils. The illustration from Wikipedia shows how four steps are acquired by powering up the respective coil in order. This powering up process needs to be controlled and hard to do manually. Using PSLab device experiment “Stepper Motor”, a user can acquire any number of steps just by entering the step value in the text box. The implementation consists of a set of method calls;

scienceLab.stepForward(steps, 100);

scienceLab.stepBackward(steps, 100);

A delay of 100 milliseconds is provided so that there is enough time to produce a step. Otherwise the shaft will not experience enough resultant force to move and will remain in the same position.

These two experiments are possible with PSLab because the amount of current drawn is quite small which can be delivered through a general USB port. It is worth mentioning that as industry grade servo and stepper motors may draw high current as they were built to interact with heavy loads, they are not suitable for this type of experiments.

Resources:

Continue ReadingControlling Motors using PSLab Device

Performing Multivibrator Experiments in PSLab Android App

A Multivibrator is an Oscillator that produces non-sinusoidal signals like Square Wave. Multivibrators are considered to be the building blocks of almost every electronic device.

Multivibrators are the level changing circuit. Every circuit works on two level, “high” and “low”. Multivibrators changes between these two level to produce a particular voltage form.

PSLab Android App helps us to observe the input and the output signals captured from these circuits. This enables student or researchers to study the input and output waveforms. Let’s discuss various Multivibrator Experiments that can be conducted using PSLab and how they are implemented.


There are three types of multivibrator:

  1. Astable multivibrator
  2. Bistable multivibrator
  3. Monostable multivibrator

Astable Multivibrator


An astable-multivibrator circuit’s output oscillates continuously between its two unstable states. It is a cross-coupled transistor switching circuit. They are also known as Free Multivibrator as any additional inputs or external assistance to oscillate are not required by them. Astable oscillators produce a continuous square wave from its output

Astable are used as clocks and timers, bistable as flip flops, the memory, registers and counters, Schmitt triggers as memory, switches, wave shapers.

The following is the circuit diagram.

In order to observe the behaviour of Astable Multivibrator, LED’s can be also used.

We get the following waveform when captured using the PSLab device.

Monostable Multivibrator

Monostable is also known as one shot multivibrator. In monostable multivibrator, there is one stable state and one astable state. A trigger pulse is required to enter into the astable state or get back to the stable state. The monostable multivibrator is mainly used as a timer.

The following is the schematics of Monostable Multivibrator

Image link – https://circuitdigest.com/electronic-circuits/555-timer-monostable-circuit-diagram

Following signals are captured by the device while conducting the experiment.

Adding Multivibrator Experiment support in PSLab Android

This was simply achieved by reusing Oscilloscope Activity. Oscilloscope Activity is informed about the experiment by using putExtra() and getExtra() methods and Oscilloscope simply aligns its layout according to it.

Analysing Frequencies

In order to analyse the frequencies of the waves captured, we used sine fitting. Sine fitting function simply takes the data points and returns the amplitude, frequency, offset and phase shift of the wave.

Resources

Continue ReadingPerforming Multivibrator Experiments in PSLab Android App

Filling Audio Buffer to Generate Waves in the PSLab Android App

The PSLab Android App works as an oscilloscope and a wave generator using the audio jack of the Android device. The implementation of the oscilloscope in the Android device using the in-built mic has been discussed in the blog post “Using the Audio Jack to make an Oscilloscope in the PSLab Android App” and the same has been discussed in the context of wave generator in the blog post “Implement Wave Generation Functionality in the PSLab Android App”. This post is a continuation of the post related to the implementation of wave generation functionality in the PSLab Android App. In this post, the subject matter of discussion is the way to fill the audio buffer so that the resulting wave generated is either a Sine Wave, a Square Wave or a Sawtooth Wave. The resultant audio buffer would be played using the AudioTrack API of Android to generate the corresponding wave. The waves we are trying to generate are periodic waves.

Periodic Wave: A wave whose displacement has a periodic variation with respect to time or distance, or both.

Thus, the problem reduces to generating a pulse which will constitute a single time period of the wave. Suppose we want to generate a sine wave; if we generate a continuous stream of pulses as illustrated in the image below, we would get a continuous sine wave. This is the main concept that we shall try to implement using code.

Initialise AudioTrack Object

AudioTrack object is initialised using the following parameters:

  • STREAM TYPE: Type of stream like STREAM_SYSTEM, STREAM_MUSIC, STREAM_RING, etc. For wave generation purposes we are using stream music. Every stream has its own maximum and minimum volume level.  
  • SAMPLING RATE: It is the rate at which the source samples the audio signal.
  • BUFFER SIZE IN BYTES: Total size of the internal buffer in bytes from where the audio data is read for playback.
  • MODES: There are two modes-
    • MODE_STATIC: Audio data is transferred from Java to the native layer only once before the audio starts playing.
    • MODE_STREAM: Audio data is streamed from Java to the native layer as audio is being played.

getMinBufferSize() returns the estimated minimum buffer size required for an AudioTrack object to be created in the MODE_STREAM mode.

minTrackBufferSize = AudioTrack.getMinBufferSize(SAMPLING_RATE, AudioFormat.CHANNEL_OUT_MONO, AudioFormat.ENCODING_PCM_16BIT);
audioTrack = new AudioTrack(
       AudioManager.STREAM_MUSIC,
       SAMPLING_RATE,
       AudioFormat.CHANNEL_OUT_MONO,
       AudioFormat.ENCODING_PCM_16BIT,
       minTrackBufferSize,
       AudioTrack.MODE_STREAM);

Fill Audio Buffer to Generate Sine Wave

Depending on the values in the audio buffer, the wave is generated by the AudioTrack object. Therefore, to generate a specific kind of wave, we need to fill the audio buffer with some specific values. The values are governed by the wave equation of the signal that we want to generate.

public short[] createBuffer(int frequency) {
   short[] buffer = new short[minTrackBufferSize];
   double f = frequency;
   double q = 0;
   double level = 16384;
   final double K = 2.0 * Math.PI / SAMPLING_RATE;

   for (int i = 0; i < minTrackBufferSize; i++) {
         f += (frequency - f) / 4096.0;
         q += (q < Math.PI) ? f * K : (f * K) - (2.0 * Math.PI);
         buffer[i] = (short) Math.round(Math.sin(q));
   }
   return buffer;
}

Fill Audio Buffer to Generate Square Wave

To generate a square wave, let’s assume the time period to be t units. So, we need the amplitude to be equal to A for t/2 units and -A for the next t/2 units. Repeating this pulse continuously, we will get a square wave.

buffer[i] = (short) ((q > 0.0) ? 1 : -1);

Fill Audio Buffer to Generate Sawtooth Wave

Ramp signals increases linearly with time. A Ramp pulse has been illustrated in the image below:

We need repeated ramp pulses to generate a continuous sawtooth wave.

buffer[i] = (short) Math.round((q / Math.PI));

Finally, when the audio buffer is generated, write it to the audio sink for playback using write() method exposed by the AudioTrack object.

audioTrack.write(buffer, 0, buffer.length);

Resources

Continue ReadingFilling Audio Buffer to Generate Waves in the PSLab Android App

Performing Oscillator Experiments with PSLab

Using PSLab we can read the waveform generated by different Oscillators. First, let’s discuss what’s an Oscillator? An Oscillator is an electronic circuit that converts unidirectional current flow from a DC source into an alternating waveform. Oscillators can produce a sine wave, triangular wave or square wave. Oscillators are used in computers, clocks, watches, radios, and metal detectors. In this post, we are going to discuss 3 different types of Oscillators.

  • Colpitts Oscillator
  • Phase Shift Oscillator
  • Wien Bridge Oscillator

Colpitts Oscillator

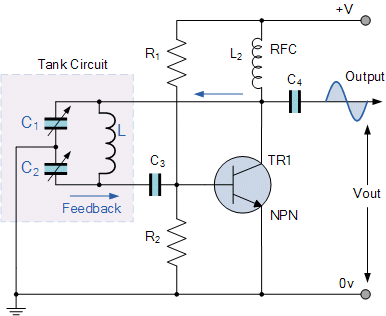
The Colpitts oscillator produces sinusoidal oscillations. The Colpitts oscillator has a tank circuit which consists of two capacitors in series and an inductor connected in parallel to the serial combination. The two capacitors in series produce a 180o phase shift which is inverted by another 180o to produce the required positive feedback. The frequency of the oscillations is determined by the value of the capacitors and inductor in the tank circuit.

Image source

Image source

Phase Shift Oscillator

A phase-shift oscillator produces a sine wave output using regenerative feedback obtained from the combination of resistor and capacitor. This regenerative feedback from the RC network is due to the ability of the capacitor to store an electric charge.

Image source

Wien bridge oscillator

A Wien bridge oscillator generates sine waves. It can generate a large range of frequencies and is based on a bridge circuit. It employs two transistors, each producing a phase shift of 180°, and thus producing a total phase-shift of 360° or 0°. It is simple in design, compact in size, and stable in its frequency output.


Image source

Mapping output waves from the Oscillator Circuits in PSLab Android app

To make PSLab Android app to support experiments related to read the waveforms received from the Oscillator we reused Oscilloscope Activity. In order to analyze the frequencies of the waves captured, we used sine fitting. Sine fitting function simply takes the data points and returns the amplitude, frequency, offset and phase shift of the wave.

The following is a glimpse of output signals from the Oscillators being captured by PSLab Android.

Resources

Read more on Oscillator from the following links

Continue ReadingPerforming Oscillator Experiments with PSLab

Performing Custom Experiments with PSLab

PSLab has the capability to perform a variety of experiments. The PSLab Android App and the PSLab Desktop App have built-in support for about 70 experiments. The experiments range from variety of trivial ones which are for school level to complicated ones which are meant for college students. However, it is nearly impossible to support a vast variety of experiments that can be performed using simple electronic circuits.

So, the blog intends to show how PSLab can be efficiently used for performing experiments which are otherwise not a part of the built-in experiments of PSLab. PSLab might have some limitations on its hardware, however in almost all types of experiments, it proves to be good enough.

  • Identifying the requirements for experiments

    • The user needs to identify the tools which are necessary for analysing the circuit in a given experiment. Oscilloscope would be essential for most experiments. The voltage & current sources might be useful if the circuit requires DC sources and similarly, the waveform generator would be essential if AC sources are needed. If the circuit involves the use and analysis of data of sensor, the sensor analysis tools might prove to be essential.
    • The circuit diagram of any given experiment gives a good idea of the requirements. In case, if the requirements are not satisfied due to the limitations of PSLab, then the user can try out alternate external features.
  • Using the features of PSLab

  • Using the oscilloscope
    • Oscilloscope can be used to visualise the voltage. The PSLab board has 3 channels marked CH1, CH2 and CH3. When connected to any point in the circuit, the voltages are displayed in the oscilloscope with respect to the corresponding channels.
    • The MIC channel can be if the input is taken from a microphone. It is necessary to connect the GND of the channels to the common ground of the circuit otherwise some unnecessary voltage might be added to the channels.

  • Using the voltage/current source
    • The voltage and current sources on board can be used for requirements within the range of +5V. The sources are named PV1, PV2, PV3 and PCS with V1, V2 and V3 standing for voltage sources and CS for current source. Each of the sources have their own dedicated ranges.
    • While using the sources, keep in mind that the power drawn from the PSLab board should be quite less than the power drawn by the board from the USB bus.
      • USB 3.0 – 4.5W roughly
      • USB 2.0 – 2.5W roughly
      • Micro USB (in phones) – 2W roughly
    • PSLab board draws a current of 140 mA when no other components are connected. So, it is advisable to limit the current drawn to less than 200 mA to ensure the safety of the device.
    • It is better to do a rough calculation of the power requirements in mind before utilising the sources otherwise attempting to draw excess power will damage the device.

  • Using the Waveform Generator
    • The waveform generator in PSLab is limited to 5 – 5000 Hz. This range is usually sufficient for most experiments. If the requirements are beyond this range, it is better to use an external function generator.
    • Both sine and square waves can be produced using the device. In addition, there is a feature to set the duty cycle in case of square waves.
  • Sensor Quick View and Sensor Data Logger
    • PSLab comes with the built in support for several plug and play sensors. The support for more sensors will be added in the future. If an experiment requires real time visualisation of sensor data, the Sensor Quick View option can be used whereas for recording the data for sensors for a period of time, the Sensor Data Logger can be used.
  • Analysing the Experiment

    • The oscilloscope is the most common tool for circuit analysis. The oscilloscope can sample data at very high frequencies (~250 kHz). The waveform at any point can be observed by connecting the channels of the oscilloscope in the manner mentioned above.
    • The oscilloscope has some features which will be essential like Trigger to stabilise the waveforms, XY Plot to plot characteristics graph of some devices, Fourier Transform of the Waveforms etc. The tools mentioned here are simple but highly useful.
    • For analysing the sensor data, the Sensor Quick View can be paused at any instant to get the data at any instant. Also, the logged data in Sensor Data Logger can be exported as a TXT/CSV file to keep a record of the data.
  • Additional Insight

    • The PSLab desktop app comes with the built-in support for the ipython console.
    • The desired quantities like voltages, currents, resistance, capacitance etc. can also be measured by using simple python commands through the ipython console.
    • A simple python script can be written to satisfy all the data requirements for the experiment. An example for the same is shown below.

This is script to produce two sine waves of 1 kHz and capturing & plotting the data.

from pylab import *
from PSL import sciencelab
I=sciencelab.connect()
I.set_gain('CH1', 2) # set input CH1 to +/-4V range
I.set_gain('CH2', 3) # set input CH2 to +/-4V range
I.set_sine1(1000) # generate 1kHz sine wave on output W1
I.set_sine2(1000) # generate 1kHz sine wave on output W2
#Connect W1 to CH1, and W2 to CH2. W1 can be attenuated using the manual amplitude knob on the PSlab
x,y1,y2 = I.capture2(1600,1.75,'CH1') 
plot(x,y1) #Plot of analog input CH1
plot(x,y2) #plot of analog input CH2
show()


References

Continue ReadingPerforming Custom Experiments with PSLab

Electrical Experiments with PSLab

PSLab has the capability to perform a variety of experiments. The PSLab Android App and the PSLab Desktop App have built-in support for over 70 experiments which are commonly performed by students. In addition to that, it can be used in other experiments conveniently. This blog post is in continuation with the previous two posts regarding performing experiments (links in the reference) and this blog deals with another category of experiments that can be performed using PSLab.

The blog lists experiments which mainly involve the basic circuit elements like resistors, capacitors and inductors. These experiments involve the study of R-C, L-R, L-C and L-C-R circuits. These circuits have properties which make them important in real life applications and this blog attempts to give a rough picture of their importance.

Ohm’s Law, Capacitive Reactance and Inductive Reactance

These experiments involve the study of each of the basic circuit element individually. The current and voltage characteristics of each of the elements is studied.

The definitions of the above are:

Ohm’s Law – This is a law familiar to most. It relates the voltage and current of a purely resistive circuit stating that the voltage and current are proportional to each other and their ratio is a constant called the resistance. In this case, the current and voltage are in the same phase.

Capacitive Reactance – Across a capacitor in an AC circuit, the current and voltage are not in the same phase and the current leads the voltage. For a purely capacitive circuit, this difference is 90o.

Inductive Reactance –  Across an inductor in an AC circuit, the current and voltage are not in the same phase and the current lags behind the voltage. For a purely inductive circuit, this difference is 90o.

The reactance is given for capacitor and inductor is given by 1/wC and wL respectively, where C & L are the values of capacitance and inductance respectively and w is the frequency of the AC signal.

The circuit for the setup is shown below. We need to observe the plot of the input waveform and the plot of the voltage across individual elements to observe the phase shift.

  1. Connect CH1 & GND across the input terminals and CH2 & GND across the terminals of any of the elements.
  2. An external signal can be used or can be generated using the PSLab. Use the PSLab to generate a sinusoidal signal of frequency 1000 Hz. by connecting the ends of PV1 in the circuit.
  3. Observe the waveforms. In case of the resistor, there should be no observable phase lag between the two. In case of the capacitor and inductor, there will be an observable phase difference of 90o.
  4. For the capacitive and inductive circuits, just replace the resistor in the above circuit with capacitor/inductor.

RC Circuits

Drawing their names from their respective calculus functions, the integrator produces a voltage output proportional to the product (multiplication) of the input voltage and time; and the differentiator (not to be confused with differential) produces a voltage output proportional to the input voltage’s rate of change.

RC Integrator circuit

For constructing the RC integrator circuit, connect the circuit as shown in the diagram.

  • Construction of the integrator circuit is fairly simple once the differentiator circuit is done.
  • Interchange the positions of the capacitor and resistor in the above circuit and the circuit for the integrator is complete.
  • Observe the output waveform. Plot both the CH1 and CH2 data simultaneously to compare the waveforms.

RC Differentiator circuit

For constructing the RC differentiator circuit, connect the circuit as shown in the diagram.

  • The values of resistance and capacitance used here are 10k ohm and 0.01uF.
  • Connect the CH1 and GND pins of the board with the input side marked as Vi. Ensure that GND is connected to the GND of the circuit.
  • Similarly, connect CH2 and GND with the corresponding ends of the output side marked as Vo.
  • PSLab can also be used for supplying the input to the circuit. Connect the ends of W1 and GND across Vi. W1 can be used to generate a square wave of 10V peak to peak voltage with a frequency of 500 Hz.
  • Observe the output waveform. Plot both the CH1 and CH2 data simultaneously to compare the waveforms.

RL Circuits

RL Integrator Circuit.

For constructing the RL integrator circuit, connect the circuit as shown in the diagram.

  • Construction of the integrator circuit is fairly simple once the differentiator circuit is done.
  • Interchange the positions of the inductor and resistor in the above circuit and the circuit for the integrator is complete.
  • Observe the output waveform. Plot both the CH1 and CH2 data simultaneously to compare the waveforms.

RL Differentiator Circuit

For constructing the RL differentiator circuit, connect the circuit as shown in the diagram.

  • The values of resistance and inductance used here are 470 ohm and 10mH.
  • Connect the CH1 and GND pins of the board with the input side marked as Vi. Ensure that GND is connected to the GND of the circuit.
  • Similarly, connect CH2 and GND with the corresponding ends of the output side marked as Vo.
  • PSLab can also be used for supplying the input to the circuit. Connect the ends of W1 and GND across Vi. W1 can be used to generate a square wave of 2V peak to peak voltage with a frequency of 5000 Hz.
  • Observe the output waveform. Plot both the CH1 and CH2 data simultaneously to compare the waveforms.

Frequency Response

Frequency Response of an electric or electronics circuit allows us to see exactly how the output gain (known as the magnitude response) and the phase (known as the phase response) changes at a particular single frequency, or over a whole range of different frequencies from 0Hz, (d.c.) to many thousands of megahertz, (MHz) depending upon the design characteristics of the circuit.

Frequency response of a circuit can be studied using different tools like Bode plots, phase plots etc. However, this blog would limit to using simple RC and RL circuits as they can be easily visualised using an oscilloscope.

RC Circuits

  • For observing the frequency response of RC circuits, the circuit can be constructed as shown below.
  • The values of resistance and capacitance used here are 10k ohm and 0.01uF.
  • Connect the CH1 and GND pins of the board with the input side marked as Vi. Ensure that GND is connected to the GND of the circuit.
  • Similarly, connect CH2 and GND with the corresponding ends of the output side marked as Vo.
  • PSLab can also be used for supplying the input to the circuit. Connect the ends of W1 and GND across Vi. W1 can be used to generate a square wave of 10V peak to peak voltage with a frequencies ranging from 100 Hz to 5000 Hz.
  • Switch to the X-Y mode of the oscilloscope and observe the waveform formed.

RL Circuits

  • For observing the frequency response of RL circuits, the circuit can be constructed as shown below.
  • The values of resistance and inductance used here are 470 ohm and 10mH.
  • Connect the CH1 and GND pins of the board with the input side marked as Vi. Ensure that GND is connected to the GND of the circuit.
  • Similarly, connect CH2 and GND with the corresponding ends of the output side marked as Vo.
  • Note: PSLab in this case cannot be used as an AC source as the maximum frequency of waveforms produced by PSLab is limited to 5kHz. However, this experiment would also need frequencies much higher than 5 Hz i.e upto 50 kHz. So, a dedicated function generator is needed. However, the oscilloscope would work just fine.
  • Switch to the X-Y mode of the oscilloscope and observe the waveform formed.

References:

  1. The previous blog on experiments using PSLab focusing in electronics https://blog.fossasia.org/electronics-experiments-with-pslab/
  2. The previous blog on experiments using PSLab involving some general experiments https://blog.fossasia.org/fascinating-experiments-with-pslab/
  3. Read more about differentiators and integrators and their uses https://www.allaboutcircuits.com/textbook/semiconductors/chpt-8/differentiator-integrator-circuits/
Continue ReadingElectrical Experiments with PSLab

Creating an Elementary Oscilloscope in PSLab’s Remote Framework

The last couple of blog posts explained how we could put together the versatility of ember components, the visual appeal of jqplot, the flexibility of Python Flask, and the simplicity of Python itself in order to make simple scripts for PSLab that would could be run on a server by a remote client anywhere on the web. We have also seen how callbacks could be assigned to widgets created in these scripts in order to make object oriented applications. In this blog post, we shall see how to assign a capture method to a button, and update a plot with the received data. It will also demonstrate how to use ember-lodash to perform array manipulations.

Specifying the return data type in the callback success routine

For a more instructive write-up on assigning callbacks, please refer to these posts .

Whenever the callback assigned to a button is a function that returns an array of elements, and the target for the resultant data is a plot, the stacking order of the returned array must be specified in order to change its shape to suit the plotting library. The default return data from a capture routine (oscilloscope) is made up of separate arrays for X coordinate and Y coordinate values. Since JQplot requires [X,Y] pairs , we must specify a stacking order of ‘xy’ so that the application knows that it must convert them to pairs (using lodash/zip)  before passing the result to the plot widget. Similarly, different stacking orders for capture2, and capture4 must also be defined.

Creating an action that performs necessary array manipulations and plots the received data

It can be seen from the excerpt below, that if the onSuccess target for a callback is specified to be a plot in the actionDefinition object, then the stacking order is checked, and the returned data is modified accordingly

Relevant excerpt from controllers/user-home.js/runButtonAction

if (actionDefinition.success.type === 'update-plot') {
  if (actionDefinition.success.stacking === 'xy') {
    $.jqplot(actionDefinition.success.target, [zip(...resultValue)]).replot();
  } else if (actionDefinition.success.stacking === 'xyy') {
    $.jqplot(actionDefinition.success.target, [zip(...[resultValue[0], resultValue[1]]), zip(...[resultValue[0], resultValue[2]])]).replot();
  } else if (actionDefinition.success.stacking === 'xyyyy') {
    $.jqplot(actionDefinition.success.target, [zip(...[resultValue[0], resultValue[1]]), zip(...[resultValue[0], resultValue[2]]), zip(...[resultValue[0], resultValue[3]]), zip(...[resultValue[0], resultValue[4]])]).replot();
  } else {
    $.jqplot(actionDefinition.success.target, resultValue).replot();
  }
}


With the above framework in place, we can add a plot with the line plt = plot(x, np.sin(x)) , and associate a button with a capture routine that will update its contents with a single line of code: button(‘capture1’,”capture1(‘CH1’,100,10)”,”update-plot”,target=plt)

Final Result

The following script created on the pslab-remote platform makes three buttons and plots, and sets the buttons to invoke capture1, capture2, and capture4 respectively when clicked.

import numpy as np
x=np.linspace(0,2*np.pi,30)
plt = plot(x, np.sin(x))
button('capture 1',"capture1('CH1',100,10)","update-plot",target=plt)

plt2 = plot(x, np.sin(x))
button('capture 2',"capture2(50,10)","update-plot",target=plt2,stacking='xyy')

plt3 = plot(x, np.sin(x))
button('capture 4',"capture4(50,10)","update-plot",target=plt3,stacking='xyyyy')


Resources


Continue ReadingCreating an Elementary Oscilloscope in PSLab’s Remote Framework