

In Susper, we have implemented a statistic infobox to show analytics regarding Top authors, Top Providers and distribution regarding protocols and Results frequency by year.
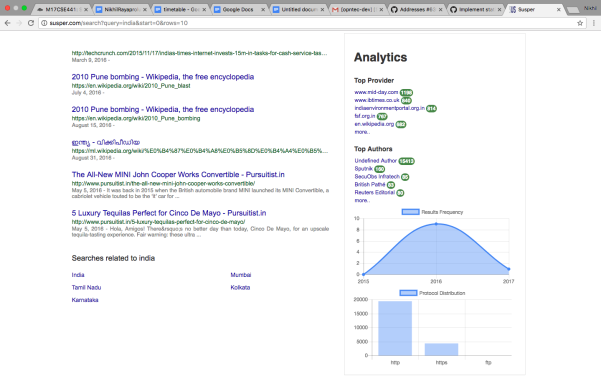
Yacy also offers additional information for infoboxes such as files types, provider and authors. Using that information which we receive along with results we have implemented the infobox.
Implementation of Infobox:
1. For the distribution graphs, we have used angular library for chart.js https://www.npmjs.com/package/ng2-charts
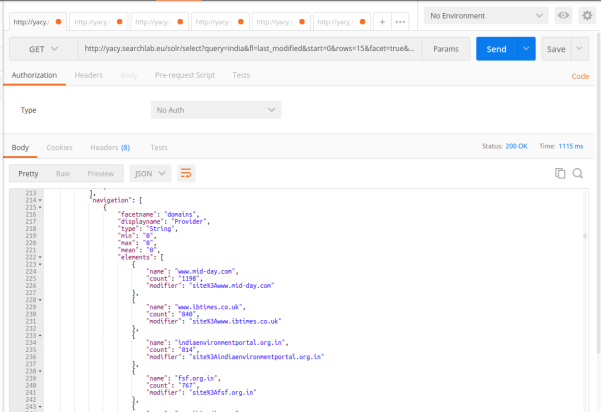
2. We receive required statistics of each facet name from Yacy using the yacy search endpoint

We have created a statbox component to display the data related to statistic infobox at https://github.com/fossasia/susper.com/tree/master/src/app/statsbox
It takes care about rendering the statistic infobox and styling it.
Statsbox.component.ts
this.navigation$.subscribe(navigation => {
   for (let nav of navigation) {
     if (nav.displayname === 'Protocol') {
       let data = [];
       let datalabels = [];
       for (let element of nav.elements){
           datalabels.push(element.name);
           data.push(parseInt(element.count, 10));
         }
       this.barChartData[0].data = data;
       this.barChartLabels = datalabels;

     }
   }
 });
});
navigation observable gives us the latest statistics information received from the yacy and we subscribe to it and update the component variables accordingly for displaying the data.
Later these values are used by statsbox.component.html to display the statsbox.
The whole implementation of this feature can be found at pull: https://github.com/fossasia/susper.com/pull/704/
References:
1.Using Postman for analysing an API Endpoint: https://www.getpostman.com/docs
2.Using ngrx store: https://github.com/ngrx/store