Electrical Experiments with PSLab

PSLab has the capability to perform a variety of experiments. The PSLab Android App and the PSLab Desktop App have built-in support for over 70 experiments which are commonly performed by students. In addition to that, it can be used in other experiments conveniently. This blog post is in continuation with the previous two posts regarding performing experiments (links in the reference) and this blog deals with another category of experiments that can be performed using PSLab.

The blog lists experiments which mainly involve the basic circuit elements like resistors, capacitors and inductors. These experiments involve the study of R-C, L-R, L-C and L-C-R circuits. These circuits have properties which make them important in real life applications and this blog attempts to give a rough picture of their importance.

Ohm’s Law, Capacitive Reactance and Inductive Reactance

These experiments involve the study of each of the basic circuit element individually. The current and voltage characteristics of each of the elements is studied.

The definitions of the above are:

Ohm’s Law – This is a law familiar to most. It relates the voltage and current of a purely resistive circuit stating that the voltage and current are proportional to each other and their ratio is a constant called the resistance. In this case, the current and voltage are in the same phase.

Capacitive Reactance – Across a capacitor in an AC circuit, the current and voltage are not in the same phase and the current leads the voltage. For a purely capacitive circuit, this difference is 90o.

Inductive Reactance –  Across an inductor in an AC circuit, the current and voltage are not in the same phase and the current lags behind the voltage. For a purely inductive circuit, this difference is 90o.

The reactance is given for capacitor and inductor is given by 1/wC and wL respectively, where C & L are the values of capacitance and inductance respectively and w is the frequency of the AC signal.

The circuit for the setup is shown below. We need to observe the plot of the input waveform and the plot of the voltage across individual elements to observe the phase shift.

  1. Connect CH1 & GND across the input terminals and CH2 & GND across the terminals of any of the elements.
  2. An external signal can be used or can be generated using the PSLab. Use the PSLab to generate a sinusoidal signal of frequency 1000 Hz. by connecting the ends of PV1 in the circuit.
  3. Observe the waveforms. In case of the resistor, there should be no observable phase lag between the two. In case of the capacitor and inductor, there will be an observable phase difference of 90o.
  4. For the capacitive and inductive circuits, just replace the resistor in the above circuit with capacitor/inductor.

RC Circuits

Drawing their names from their respective calculus functions, the integrator produces a voltage output proportional to the product (multiplication) of the input voltage and time; and the differentiator (not to be confused with differential) produces a voltage output proportional to the input voltage’s rate of change.

RC Integrator circuit

For constructing the RC integrator circuit, connect the circuit as shown in the diagram.

  • Construction of the integrator circuit is fairly simple once the differentiator circuit is done.
  • Interchange the positions of the capacitor and resistor in the above circuit and the circuit for the integrator is complete.
  • Observe the output waveform. Plot both the CH1 and CH2 data simultaneously to compare the waveforms.

RC Differentiator circuit

For constructing the RC differentiator circuit, connect the circuit as shown in the diagram.

  • The values of resistance and capacitance used here are 10k ohm and 0.01uF.
  • Connect the CH1 and GND pins of the board with the input side marked as Vi. Ensure that GND is connected to the GND of the circuit.
  • Similarly, connect CH2 and GND with the corresponding ends of the output side marked as Vo.
  • PSLab can also be used for supplying the input to the circuit. Connect the ends of W1 and GND across Vi. W1 can be used to generate a square wave of 10V peak to peak voltage with a frequency of 500 Hz.
  • Observe the output waveform. Plot both the CH1 and CH2 data simultaneously to compare the waveforms.

RL Circuits

RL Integrator Circuit.

For constructing the RL integrator circuit, connect the circuit as shown in the diagram.

  • Construction of the integrator circuit is fairly simple once the differentiator circuit is done.
  • Interchange the positions of the inductor and resistor in the above circuit and the circuit for the integrator is complete.
  • Observe the output waveform. Plot both the CH1 and CH2 data simultaneously to compare the waveforms.

RL Differentiator Circuit

For constructing the RL differentiator circuit, connect the circuit as shown in the diagram.

  • The values of resistance and inductance used here are 470 ohm and 10mH.
  • Connect the CH1 and GND pins of the board with the input side marked as Vi. Ensure that GND is connected to the GND of the circuit.
  • Similarly, connect CH2 and GND with the corresponding ends of the output side marked as Vo.
  • PSLab can also be used for supplying the input to the circuit. Connect the ends of W1 and GND across Vi. W1 can be used to generate a square wave of 2V peak to peak voltage with a frequency of 5000 Hz.
  • Observe the output waveform. Plot both the CH1 and CH2 data simultaneously to compare the waveforms.

Frequency Response

Frequency Response of an electric or electronics circuit allows us to see exactly how the output gain (known as the magnitude response) and the phase (known as the phase response) changes at a particular single frequency, or over a whole range of different frequencies from 0Hz, (d.c.) to many thousands of megahertz, (MHz) depending upon the design characteristics of the circuit.

Frequency response of a circuit can be studied using different tools like Bode plots, phase plots etc. However, this blog would limit to using simple RC and RL circuits as they can be easily visualised using an oscilloscope.

RC Circuits

  • For observing the frequency response of RC circuits, the circuit can be constructed as shown below.
  • The values of resistance and capacitance used here are 10k ohm and 0.01uF.
  • Connect the CH1 and GND pins of the board with the input side marked as Vi. Ensure that GND is connected to the GND of the circuit.
  • Similarly, connect CH2 and GND with the corresponding ends of the output side marked as Vo.
  • PSLab can also be used for supplying the input to the circuit. Connect the ends of W1 and GND across Vi. W1 can be used to generate a square wave of 10V peak to peak voltage with a frequencies ranging from 100 Hz to 5000 Hz.
  • Switch to the X-Y mode of the oscilloscope and observe the waveform formed.

RL Circuits

  • For observing the frequency response of RL circuits, the circuit can be constructed as shown below.
  • The values of resistance and inductance used here are 470 ohm and 10mH.
  • Connect the CH1 and GND pins of the board with the input side marked as Vi. Ensure that GND is connected to the GND of the circuit.
  • Similarly, connect CH2 and GND with the corresponding ends of the output side marked as Vo.
  • Note: PSLab in this case cannot be used as an AC source as the maximum frequency of waveforms produced by PSLab is limited to 5kHz. However, this experiment would also need frequencies much higher than 5 Hz i.e upto 50 kHz. So, a dedicated function generator is needed. However, the oscilloscope would work just fine.
  • Switch to the X-Y mode of the oscilloscope and observe the waveform formed.

References:

  1. The previous blog on experiments using PSLab focusing in electronics https://blog.fossasia.org/electronics-experiments-with-pslab/
  2. The previous blog on experiments using PSLab involving some general experiments https://blog.fossasia.org/fascinating-experiments-with-pslab/
  3. Read more about differentiators and integrators and their uses https://www.allaboutcircuits.com/textbook/semiconductors/chpt-8/differentiator-integrator-circuits/
Continue ReadingElectrical Experiments with PSLab

Enabling Google App Signing for Android Project

Signing key management of Android Apps is a hectic procedure and can grow out of hand rather quickly for large organizations with several independent projects. We, at FOSSASIA also had to face similar difficulties in management of individual keys by project maintainers and wanted to gather all these Android Projects under singular key management platform:

To handle the complexities and security aspect of the process, this year Google announced App Signing optional program where Google takes your existing key’s encrypted file and stores it on their servers and asks you to create a new upload key which will be used to sign further updates of the app. It takes the certificates of your new upload key and maps it to the managed private key. Now, whenever there is a new upload of the app, it’s signing certificate is matched with the upload key certificate and after verification, the app is signed by the original private key on the server itself and delivered to the user. The advantage comes where you lose your key, its password or it is compromised. Before App Signing program, if your key got lost, you had to launch your app under a new package name, losing your existing user base. With Google managing your key, if you lose your upload key, then the account owner can request Google to reassign a new upload key as the private key is secure on their servers.

There is no difference in the delivered app from the previous one as it is still finally signed by the original private key as it was before, except that Google also optimizes the app by splitting it into multiple APKs according to hardware, demographic and other factors, resulting in a much smaller app! This blog will take you through the steps in how to enable the program for existing and new apps. A bit of a warning though, for security reasons, opting in the program is permanent and once you do it, it is not possible to back out, so think it through before committing.

For existing apps:

First you need to go to the particular app’s detail section and then into Release Management > App Releases. There you would see the Get Started button for App Signing.

The account owner must first agree to its terms and conditions and once it’s done, a page like this will be presented with information about app signing infrastructure at top.

So, as per the instructions, download the PEPK jar file to encrypt your private key. For this process, you need to have your existing private key and its alias and password. It is fine if you don’t know the key password but store password is needed to generate the encrypted file. Then execute this command in the terminal as written in Step 2 of your Play console:

java -jar pepk.jar –keystore={{keystore_path}} –alias={{alias}} –output={{encrypted_file_output_path}} –encryptionkey=eb10fe8f7c7c9df715022017b00c6471f8ba8170b13049a11e6c09ffe3056a104a3bbe4ac5a955f4ba4fe93fc8cef27558a3eb9d2a529a2092761fb833b656cd48b9de6a

You will have to change the bold text inside curly braces to the correct keystore path, alias and the output file path you want respectively.

Note: The encryption key has been same for me for 3 different Play Store accounts, but might be different for you. So please confirm in Play console first

When you execute the command, it will ask you for the keystore password, and once you enter it, the encrypted file will be generated on the path you specified. You can upload it using the button on console.

After this, you’ll need to generate a new upload key. You can do this using several methods listed here, but for demonstration we’ll be using command line to do so:

keytool -genkey -v -keystore {{keystore_path}} -alias {{alias_name}} -keyalg RSA -keysize 2048 -validity 10000

The command will ask you a couple of questions related to the passwords and signing information and then the key will be generated. This will be your public key and be used for further signing of your apps. So keep it and the password secure and handy (even if it is expendable now).

After this step, you need to create a PEM upload certificate for this key, and in order to do so, execute this command:

keytool -export -rfc -keystore {{keystore_path}} -alias {{alias_name}} -file {{upload_certificate.pem}}

After this is executed, it’ll ask you the keystore password, and once you enter it, the PEM file will be generated and you will have to upload it to the Play console.

If everything goes right, your Play console will look something like this:


Click enrol and you’re done! Now you can go to App Signing section of the Release Management console and see your app signing and new upload key certificates


You can use the SHA1 hash to confirm the keys as to which one corresponds to private and upload if ever in confusion.

For new apps:

For new apps, the process is like a walk in park. You just need to enable the App Signing, and you’ll get an option to continue, opt-out or re-use existing key.


If you re-use existing key, the process is finished then and there and an existing key is deployed as the upload key for this app. But if you choose to Continue, then App Signing will be enabled and Google will use an arbitrary key as private key for the app and the first app you upload will get its key registered as the upload key


This is the screenshot of the App Signing console when there is no first app uploaded and you can see that it still has an app signing certificate of a key which you did not upload or have access to.

If you want to know more about app signing program, check out these links:

Continue ReadingEnabling Google App Signing for Android Project

Creating an Elementary Oscilloscope in PSLab’s Remote Framework

The last couple of blog posts explained how we could put together the versatility of ember components, the visual appeal of jqplot, the flexibility of Python Flask, and the simplicity of Python itself in order to make simple scripts for PSLab that would could be run on a server by a remote client anywhere on the web. We have also seen how callbacks could be assigned to widgets created in these scripts in order to make object oriented applications. In this blog post, we shall see how to assign a capture method to a button, and update a plot with the received data. It will also demonstrate how to use ember-lodash to perform array manipulations.

Specifying the return data type in the callback success routine

For a more instructive write-up on assigning callbacks, please refer to these posts .

Whenever the callback assigned to a button is a function that returns an array of elements, and the target for the resultant data is a plot, the stacking order of the returned array must be specified in order to change its shape to suit the plotting library. The default return data from a capture routine (oscilloscope) is made up of separate arrays for X coordinate and Y coordinate values. Since JQplot requires [X,Y] pairs , we must specify a stacking order of ‘xy’ so that the application knows that it must convert them to pairs (using lodash/zip)  before passing the result to the plot widget. Similarly, different stacking orders for capture2, and capture4 must also be defined.

Creating an action that performs necessary array manipulations and plots the received data

It can be seen from the excerpt below, that if the onSuccess target for a callback is specified to be a plot in the actionDefinition object, then the stacking order is checked, and the returned data is modified accordingly

Relevant excerpt from controllers/user-home.js/runButtonAction

if (actionDefinition.success.type === 'update-plot') {
  if (actionDefinition.success.stacking === 'xy') {
    $.jqplot(actionDefinition.success.target, [zip(...resultValue)]).replot();
  } else if (actionDefinition.success.stacking === 'xyy') {
    $.jqplot(actionDefinition.success.target, [zip(...[resultValue[0], resultValue[1]]), zip(...[resultValue[0], resultValue[2]])]).replot();
  } else if (actionDefinition.success.stacking === 'xyyyy') {
    $.jqplot(actionDefinition.success.target, [zip(...[resultValue[0], resultValue[1]]), zip(...[resultValue[0], resultValue[2]]), zip(...[resultValue[0], resultValue[3]]), zip(...[resultValue[0], resultValue[4]])]).replot();
  } else {
    $.jqplot(actionDefinition.success.target, resultValue).replot();
  }
}


With the above framework in place, we can add a plot with the line plt = plot(x, np.sin(x)) , and associate a button with a capture routine that will update its contents with a single line of code: button(‘capture1’,”capture1(‘CH1’,100,10)”,”update-plot”,target=plt)

Final Result

The following script created on the pslab-remote platform makes three buttons and plots, and sets the buttons to invoke capture1, capture2, and capture4 respectively when clicked.

import numpy as np
x=np.linspace(0,2*np.pi,30)
plt = plot(x, np.sin(x))
button('capture 1',"capture1('CH1',100,10)","update-plot",target=plt)

plt2 = plot(x, np.sin(x))
button('capture 2',"capture2(50,10)","update-plot",target=plt2,stacking='xyy')

plt3 = plot(x, np.sin(x))
button('capture 4',"capture4(50,10)","update-plot",target=plt3,stacking='xyyyy')


Resources


Continue ReadingCreating an Elementary Oscilloscope in PSLab’s Remote Framework

Export Sensor Data from the PSLab Android App

The PSLab Android App allows users to log data from the sensors connected to the PSLab hardware device. Sensor Data is stored locally but can be exported in various formats. Currently the app supports exporting data in .txt and .csv (comma-separated values) format. Exported data can be used by other users or scientists to study or analyze the data. Data can also be used by other softwares like Python, GNU octave, Matlab to further process it or visualise it in 3D. In this post, we will discuss how to export the locally stored realm data in .txt or .csv format. We will take the data of MPU6050 sensor as an example for understanding how locally logged data is exported.

Query Local Realm Data

We have attached a long click listener to sensor list view that detects which list item is selected. Clicking any sensor from sensor list for slightly longer than usual would result in a dialog popping up with the option to

  • Export Data: Results in exporting data in a format which is selected in App settings
  • Share Data: Shares sensor data with other users or on social media (yet to be implemented)
Source: PSLab Android App

As soon as the Export Data option is selected from the dialog, sensor data of the corresponding sensor is queried. The data model of the sensor and how it’s saved in the local realm database is discussed in the post Sensor Data Logging in the PSLab Android App.

RealmResults<DataMPU6050> results = realm.where(DataMPU6050.class).findAll();

Once we get the required data, we need to write it in .txt or .csv format depending on what the user has selected as a preference in App Settings.

Getting User Preference from App Settings

The format in which the sensor data should be exported is presented to the user as a preference in App Settings. Currently the app supports two formats .txt and .csv.

Source: PSLab Android App
private String format;
SharedPreferences preferences = PreferenceManager.getDefaultSharedPreferences(this);
String formatValue = preferences.getString("export_data_format_list", "0");
if ("0".equals(formatValue))
   format = "txt";
else
   format = "csv";

Export Data in .txt Format

To export the sensor data in .txt format, we need to create a .txt file in the external storage. folder variable is a path to PSLab Android folder in the external storage. If the folder doesn’t exist, it will be created.

File folder = new File(Environment.getExternalStorageDirectory() + File.separator + "PSLab Android");

After getting reference of the app folder in the external storage, we would create a text file in the PSLab Android folder. As soon as the text file is created, we initialize the FileOutputStream object to write data into the text file. The sensor data that was queried in the previous section is written into the text file just created. Finally after the complete sensor data is written, the stream is closed by stream.close() method.

FileOutputStream stream = null;
File file = new File(folder, "sensorData.txt");
try {
   stream = new FileOutputStream(file);
   for (DataMPU6050 temp : results) {
       stream.write((String.valueOf(temp.getAx()) + " " + temp.getAy() + " " + temp.getAz() + " " +
               temp.getGx() + " " + temp.getGy() + " " + temp.getGz() + " " + temp.getTemperature() + "\n").getBytes());
   }
} catch (IOException e) {
   e.printStackTrace();
} finally {
   try {
       if (stream != null) {
           stream.close();
       }
   } catch (IOException e) {
       e.printStackTrace();
   }
}

Export Data in .csv Format

Writing data in .csv format is similar to that in .txt format. As CSV stands for Comma Separated Values, which means each data value is separated by “,” (comma). It is similar to an excel sheet. The first row consists of labels that denote the type of value in that particular column. The other rows consist of the sensor data, with each row corresponding to a sample of the sensor data.

File file = new File(folder, "sensorData.csv");
PrintWriter writer;
try {
   writer = new PrintWriter(file);
   StringBuilder stringBuilder = new StringBuilder();
   stringBuilder.append("Ax,Ay,Ax,Gx,Gy,Gz,Temperature\n");
   for (DataMPU6050 temp : results) {
       stringBuilder.append(String.valueOf(temp.getAx()));
       stringBuilder.append(',');
       stringBuilder.append(String.valueOf(temp.getAy()));
       stringBuilder.append(',');
       stringBuilder.append(String.valueOf(temp.getAz()));
       stringBuilder.append(',');
       stringBuilder.append(String.valueOf(temp.getGx()));
       stringBuilder.append(',');
       stringBuilder.append(String.valueOf(temp.getGy()));
       stringBuilder.append(',');
       stringBuilder.append(String.valueOf(temp.getGz()));
       stringBuilder.append(',');
       stringBuilder.append(String.valueOf(temp.getTemperature()));
       stringBuilder.append('\n');
   }
   writer.write(stringBuilder.toString());
   writer.close();
} catch (FileNotFoundException e) {
   e.printStackTrace();
}

Resources

Continue ReadingExport Sensor Data from the PSLab Android App

How Switch Case improve performance in PSLab Saved Experiments

PSLab android application contains nearly 70 experiments one can experiment on using the PSLab device and the other necessary circuit components and devices. These experiments span over areas such as Electronics, Electrical, Physical and High school level. All these experiments are accessible via an android adapter in the repository named “PerformExperimentAdapter”. This adapter houses a tab view with two different tabs; one for the experiment details and the other for actual experiment and resultant graphs.

The adapter extends an inbuilt class FragmentPagerAdapter;

public class PerformExperimentAdapter extends FragmentPagerAdapter

This class displays every page attached to its viewpager as a fragment. The good thing about using fragments is that they have a recyclable life cycle. Rather than creating new views for every instance of an experiment, the similar views can be recycled to use once again saving resources and improving performance. FragmentPagerAdapter needs to override a method to display the correct view on the tab select by user.

@Override
public Fragment getItem(int position) {

}

Depending on the value of position, relevant experiment documentation and the experiment implementation fragments are displayed determined using the experiment title. Performance can be critical in this place as if it takes too long to process and render a fragment, user will feel a lag.

The previous implementation was using consecutive if statements.

@Override
public Fragment getItem(int position) {
   switch (position) {
       case 0:
           if (experimentTitle.equals(context.getString(R.string.diode_iv)))
               return ExperimentDocFragment.newInstance("D_diodeIV.html");
           if (experimentTitle.equals(context.getString(R.string.zener_iv)))
               return ExperimentDocFragment.newInstance("D_ZenerIV.html");
           ...
       case 1:
           if (experimentTitle.equals(context.getString(R.string.diode_iv)))
               return ZenerSetupFragment.newInstance();
           if (experimentTitle.equals(context.getString(R.string.zener_iv)))
               return DiodeExperiment.newInstance(context.getString(R.string.half_wave_rectifier));
           ...
       default:
           return ExperimentDocFragment.newInstance("astable-multivibrator.html");
   }
}

This setup was suitable for applications where there is less than around 5 choices to chose between. As the list grows, the elements in the end of the if layers will take more time to load as each of the previous if statements need to be evaluated false in order to reach the bottom statements.

This is when this implementation was replaced using switch case statements instead of consecutive if statements. The theory behind the performance improvement involves algorithm structures; Hash Tables

Hash Tables

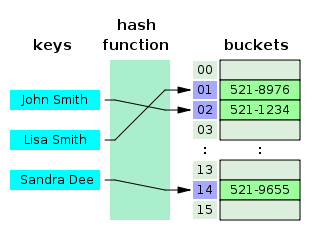
Hash tables use a hash function to calculate the index of the destination cell. This operation on average has a complexity of O(1) which means it will take the same time to access any two elements which are randomly positioned.

This is possible because java uses the hash code of the string to determine the index where the target is situated at. This way it is much faster than consecutive if statement calls where in the worst case it will take O(n) time to reach the statement causing a lag in the application.

Current application uses switch cases in the PerformExperimentAdapter;

@Override
public Fragment getItem(int position) {
   switch (position) {
       case 0:
           switch (experimentTitle) {
               case "Diode IV Characteristics":
                   return ExperimentDocFragment.newInstance("D_diodeIV.html");
               case "Zener IV Characteristics":
                   return ExperimentDocFragment.newInstance("D_ZenerIV.html");
               case "Half Wave Rectifier":
                   return ExperimentDocFragment.newInstance("L_halfWave.html");
           }
       case 1:
           switch (experimentTitle) {
               case "Diode IV Characteristics":
                   return ZenerSetupFragment.newInstance();
               case "Zener IV Characteristics":
                   return ZenerSetupFragment.newInstance();
               case "Half Wave Rectifier":
                   return DiodeExperiment.newInstance(context.getString(R.string.half_wave_rectifier));
           }
       default:
           return ExperimentDocFragment.newInstance("astable-multivibrator.html");
   }
}

There is one downfall in using switch case in the context. That is the inability to use string resources directly as Java requires a constant literals in the evaluation statement of a case.

Resources:

Continue ReadingHow Switch Case improve performance in PSLab Saved Experiments

Coloring Waveforms in PSLab Charts

Charts are used to display set of data in an analytical manner such that an observer can easily come to a conclusion by just looking at it without having to go through all the numerical data sets. Legends are used to differentiate a set of data set from another set. Generally, different colors and different names are used to form a legend in a chart.

MPAndroidChart is an amazing library with the capability of generating different types of graphs in an Android device. In PSLab several user interfaces are implemented using LineCharts to display different waveforms such as readings from channels attached to PSLab device, logic levels etc.

When several data sets are being plotted on the same graph area, legends are used. In PSLab Android application, Oscilloscope supports four different type of waveforms to be plotted on the same graph. Logic Analyzer implements one to four different types of logic level waveforms on the same plot. To identify which is which, legends with different colors can be used rather than just the names. For the legends to have different colors, it should be explicitly set which color should be held by which data set. Otherwise it will use the default color to all the legends making it hard to differentiate data lines when there are more than one data set is plotted.

Assume a data set is generated from a reading taken from a probe attached to PSLab device. The set will be added as an Entry to an array list as follows;

ArrayList<Entry> dataSet = new ArrayList<Entry>();

The next step will be to create a Line Data Set

LineDataSet lineData = new LineDataSet(dataSet, "DataSet 1");

This LineDataSet will contain sample values of the waveform captured by the microprocessor. A LineDataSet object support many methods to alter its look and feel. In order to set a color for the legend, setColor() method will be useful. This method accepts an integer as the color. This method can be accessed as follows;

lineData.setColor(Color.YELLOW);

MPAndroidChart provides different sets of colors under ColorTemplate. This class has several predefined colors with five colors in each color palette are added by the developers of the library and they can be accessed using the following line of code by simply calling the index value of the palette array list.

set1.setColor(ColorTemplate.JOYFUL_COLORS[0]);

Set of color palettes available in the ColorTemplate class are;

  1. LIBERTY_COLORS
  2. JOYFUL_COLORS
  3. PASTEL_COLORS
  4. COLORFUL_COLORS
  5. VORDIPLOM_COLORS
  6. MATERIAL_COLORS

The following demonstrates how the above activities produce a line chart with three different data sets with different colored legends.

This implementation can be used to enhance the readability of the waveforms letting user being able to differentiate between one waveform from another in PSLab Android application.

Resources:

PSLab official web site: https://pslab.fossasia.org/

Continue ReadingColoring Waveforms in PSLab Charts

Performing Diode Clipping and Clamping Experiment in PSLab Android

We can perform experiments like diode clipping and clamping using PSLab Android. A circuit which removes the peak of a waveform is known as a clipper. Diode clipper cuts off the top half or lower half or both top and lower half of the input signal. 

Different types of clipping circuits listed below

Different Clipping Experiments

A clamper circuit adds the positive dc component to the input signal to push it to the positive side. Similarly, a clamper circuit adds the negative dc component to the input signal to push it to the negative side. It basically shifts the input signal without changing the shape of the signal.

Different Clamping Experiments

Apparatus

Diode, Resistance, Capacitor (only for diode clamping), Breadboard, Wires and PSLab

Adding Diode Clipping Experiment support in PSLab Android App

To support Diode Clipping Experiment we require generating a sine wave and a dc component. This can be done using W1 and PV1 pins in PSLab device. Both input and output signals can be read using CH1 and CH2. So, when the Diode Clipping Experiment needs to be performed the following code needs to be implemented

scienceLab.setSine1(5000);
scienceLab.setPV1(//progress of the seekbar);

The signals are recorded using Oscilloscope Activity.

Adding Diode Clamping Experiment support in PSLab Android App

Diode Clamping Experiment was implemented similarly to Diode Clipping Experiment. The following are the screenshots of the experiment.     

The following is a glimpse of Diode Clamping Experiment performed using PSLab device using PSLab Android App.

Resources

  1. Read more about Clipper Circuits –
  2. Read more information about Clamping Circuits –
Continue ReadingPerforming Diode Clipping and Clamping Experiment in PSLab Android

Including a Graph Component in the Remote Access Framework for PSLab

The remote-lab software of the pocket science lab enables users to access their devices remotely via the Internet. It includes an API server designed with Python Flask, and a web-app designed with EmberJS that allows users to access the API and carry out various tasks such as writing and executing Python scripts. In a series of blog posts, various aspects of this framework such as  remote execution of function strings, automatic deployment on various domains, creating and submitting python scripts which will be run on the remote server etc have already been explored.  This blog post deals with the inclusion of a graph component in the webapp that will be invoked when the user utilises the `plot` command in their scripts.

The JQPLOT library is being used for this purpose, and has been found to be quite lightweight and has a vast set of example code .

Task list for enabling the plotting feature
  • Add a plot method to the codeEvaluator module in the API server and allow access to it by adding it to the evalGlobals dictionary
  • Create an EmberJS component for handling plots
    • Create a named div in the template
    • Invoke the Jqplot initializer from the JS file and pass necessary arguments and data to the jqplot instance
  • Add a conditional statement to include the jqplot component whenever a plot subsection is present in the JSON object returned by the API server after executing a script
Adding a plot method to the API server

Thus far, in addition to the functions supported by the sciencelab.py instance of PSLab, users had access to print, print_, and button functions. We shall now add a plot function.

def plot(self,x,y,**kwargs):
self.generatedApp.append({"type":"plot","name":kwargs.get('name','myPlot'),"data":[np.array([x,y]).T.tolist()]})


The X,Y datasets provided by the user are stacked in pairs because jqplot requires [x,y] pairs . not separate datasets.

We also need to add this to evalGlobals, so we shall modify the __init__ routine slightly:

self.evalGlobals['plot']=self.plot
Building an Ember component for handling plots

First, well need to install jqplot:   bower install –save jqplot

And this must be followed by including the following files using app.import statements in ember-cli-build.js

  • bower_components/jqplot/jquery.jqplot.min.js
  • bower_components/jqplot/plugins/jqplot.cursor.js
  • bower_components/jqplot/plugins/jqplot.highlighter.js
  • bower_components/jqplot/plugins/jqplot.pointLabels.js
  • bower_components/jqplot/jquery.jqplot.min.css

In addition to the jqplot js and css files, we have also included a couple of plugins we shall use later.

Now we need to set up a new component : ember g component jqplot-graph

Our component will accept an object as an input argument. This object will contain the various configuration options for the plot

Add the following line in templates/components/jqplot-graph.hbs:

style="solid gray 1px;" id="{{data.name}}">

The JS file for this template must invoke the jqplot function in order to insert a complete plot into the previously defined <div> after it has been created. Therefore, the initialization routine must override the didInsertElement routine of the component.

components/jqplot-graph.js

import Ember from 'ember';

export default Ember.Component.extend({
  didInsertElement () {
    Ember.$.jqplot(this.data.name,this.data.data,{
        title: this.title,

        axes: {
          xaxis: {
            tickInterval: 1,
            rendererOptions: {
            minorTicks: 4
            }
          },
        },
        highlighter: {
          show: true, 
          showLabel: true, 

          tooltipAxes: 'xy',
          sizeAdjust: 9.5 , tooltipLocation : 'ne'
        },				  
        legend: {
          show: true,
          location: 'e',
          rendererOptions: {
            numberColumns: 1,
          }
        },
        cursor:{ 
          show: true,
          zoom:true, 
          showTooltip:false
          } 

    });
  }
});

Our component is now ready to be used , and we must make the necessary changes to user-home.hbs in order to include the plot component if the output JSON of a script executed on the server contains it.

The following excerpt from the results modal shows how the plot component can be inserted

{{#each codeResults as |element|}}
	{{#if (eq element.type 'text')}}
		{{element.value}}<br>
	{{/if}}
	{{#if (eq element.type 'plot')}}
		{{jqplot-graph data=element}}
	{{/if}}
{{/each}}            

Most of the other components such as buttons and spans have been removed for clarity. Note that the element object is passed to the jqplot-graph component as an argument so that the component may configure itself accordingly.

In conclusion, the following screencast shows what we have created. A simple plot command creates a fancy plot in the output which includes data point highlighting, and can be easily configured to do a lot more. In the next blog post we shall explore how to use this plot to create a persistent application such as an oscilloscope.

Resources:


Continue ReadingIncluding a Graph Component in the Remote Access Framework for PSLab

Sensor Data Logging in the PSLab Android App

The PSLab Android App allows users to log data from sensors connected to the PSLab hardware device. The Connected sensors should support I2C, SPI communication protocols to communicate with the PSLab device successfully. The only prerequisite is the additional support for the particular sensor plugin in Android App. The user can log data from various sensors and measure parameters like temperature, humidity, acceleration, magnetic field, etc. These parameters are useful in predicting and monitoring the environment and in performing many experiments.

The support for the sensor plugins was added during the porting python communication library code to Java. In this post,  we will discuss how we logged real time sensor data from the PSLab Hardware Device. We used Realm database to store the sensor data locally. We have taken the MPU6050 sensor as an example to understand the complete process of logging sensor data.

Creating Realm Object for MPU6050 Sensor Data

The MPU6050 sensor gives the acceleration and gyroscope readings along the three axes X, Y and Z. So the data object storing the readings of the mpu sensor have variables to store the acceleration and gyroscope readings along all three axes.

public class DataMPU6050 extends RealmObject {

   private double ax, ay, az;
   private double gx, gy, gz;
   private double temperature;

   public DataMPU6050() {  }

   public DataMPU6050(double ax, double ay, double az, double gx, double gy, double gz, double temperature) {
       this.ax = ax;
       this.ay = ay;
       this.az = az;
       this.gx = gx;
       this.gy = gy;
       this.gz = gz;
       this.temperature = temperature;
   }

  // getter and setter for all variables
}

Creating Runnable to Start/Stop Data Logging

To sample the sensor data at 500ms interval, we created a runnable object and passed it to another thread which would prevent lagging of the UI thread. We can start/stop logging by changing the value of the boolean loggingThreadRunning on button click. TaskMPU6050 is an AsyncTask which reads each sample of sensor data from the PSLab device, it gets executed inside a while loop which is controlled by boolean loggingThreadRunning. Thread.sleep(500) pauses the thread for 500ms, this is also one of the reason to transfer the logging to another thread instead of logging the sensor data in UI thread. If such 500ms delays are incorporated in UI thread, app experience won’t be smooth for the users.

Runnable loggingRunnable = new Runnable() {
   @Override
   public void run() {
       try {
           MPU6050 sensorMPU6050 = new MPU6050(i2c);
           while (loggingThreadRunning) {
               TaskMPU6050 taskMPU6050 = new TaskMPU6050(sensorMPU6050);
               taskMPU6050.execute();
              // use lock object to synchronize threads
               Thread.sleep(500);
           }
       } catch (IOException   InterruptedException e) {
           e.printStackTrace();
       }
   }
};

Sampling of Sensor Data

We created an AsyncTask to read each sample of the sensor data from the PSLab device in the background thread. The getRaw() method read raw values from the sensor and returned an ArrayList containing the acceleration and gyro values. After the values were read successfully, they were updated in the data card in the foreground which was visible to the user. This data card acts as a real-time screen for the user. All the samples read are appended to ArrayList mpu6050DataList, when the user clicks on button Save Data, the collected samples are saved to the local realm database.

private ArrayList<DataMPU6050> mpu6050DataList = new ArrayList<>();

private class TaskMPU6050 extends AsyncTask<Void, Void, Void> {

   private MPU6050 sensorMPU6050;
   private ArrayList<Double> dataMPU6050 = new ArrayList<>();

   TaskMPU6050(MPU6050 mpu6050) {
       this.sensorMPU6050 = mpu6050;
   }

   @Override
   protected Void doInBackground(Void... params) {
       try {
           dataMPU6050 = sensorMPU6050.getRaw();
       } catch (IOException e) {
           e.printStackTrace();
       }
       return null;
   }

   @Override
   protected void onPostExecute(Void aVoid) {
       super.onPostExecute(aVoid);
       // update data card TextViews with data read.
       DataMPU6050 tempObject = new DataMPU6050(dataMPU6050.get(0), dataMPU6050.get(1), dataMPU6050.get(2),
               dataMPU6050.get(4), dataMPU6050.get(5), dataMPU6050.get(6), dataMPU6050.get(3));
       mpu6050DataList.add(tempObject);
       synchronized (lock) {
           lock.notify();
       }
   }
}
Source: PSLab Android App

There is an option for Start/Stop Logging, clicking on which will change the value of boolean loggingThreadRunning which stops starts/stops the logging thread.

When the Save Data button is clicked, all the samples of sensor data collected from the  PSLab device till that point are saved to the local realm database.

realm.beginTransaction();
for (DataMPU6050 tempObject : mpu6050DataList) {
   realm.copyToRealm(tempObject);
}
realm.commitTransaction();

Data can also be written asynchronously to the local realm database. For other methods to write to a real database refer write section of Realm docs.

Resources

Continue ReadingSensor Data Logging in the PSLab Android App

Enhancing the Functionality of User Submitted Scripts in the PSLab-remote framework

The remote-lab framework of the pocket science lab enables users to access their devices remotely via the internet. Its design involves an API server built with Python-Flask and a webapp that uses EmberJS. This post is the latest in a series of blog posts which have explored and elaborated various aspect of the remote-lab such as designing the API server and testing with Postman, remote execution of function strings, automatic deployment on various domains etc. It also supports creating and submitting python scripts which will be run on the remote server, and the console output relayed to the webapp.

In this post, we shall take a look at how we can extend the functionality by providing support for object oriented code in user submitted scripts.

Let’s take an example of a Python script where the user wishes to create a button which when clicked will read a voltage via the API server, and display the value to the remote user. Clearly, an interpreter that only provides the console output is not enough for this task. We need the interpreter to generate an app structure that also includes callbacks for widgets such as buttons, and JSON objects are an obvious choice for relaying such a structure to the webapp.

In a nutshell, we had earlier created an API method that could execute a python script and return a string output, and now we will modify this method to return a JSON encoded structure which will be parsed by the webapp in order to display an output.

Let’s elaborate this with an example : Example.py

print ('testing')
print ('testing some changes..... ')
print_('highlighted print statement')


JSON returned by the API [localhost:8000/runScriptById] , for the above script:

{"Date": "Tue, 01 Aug 2017 21:39:12 GMT", "Filename": "example.py", "Id": 4,
 "result": [
  {"name": "print", "type": "span", "value": "('testing',)"},
  {"name": "print", "type": "span", "value": "('testing some changes..... ',)"},
  {"class": "row well", "name": "print", "type": "span", "value": "highlighted print statement"}
  ],
"status": true}
Screenshot of the EmberJS webapp showing the output rendered with the above JSON

Adding Support for Widgets

In the previous section, we laid the groundwork for a flexible platform. Instead of returning a string, the webapp accepts a JSON object and parses it. We shall now add support for a clickable button which can be associated with a valid PSLab function.

An elementary JS twiddle has been made by Niranjan Rajendran which will help newbies to understand how to render dynamic templates via JSON objects retrieved from APIs. The twiddle uses two API endpoints; one to retrieve the compiled JSON output, and another to act as a voltmeter method which returns a voltage value.

To understand how this works in pslab-remote, consider a one line script called button.py:

button('get voltage',"get_voltage('CH1')")

The objective is to create a button with the text ‘get voltage’ on it , and which when clicked will run the command ‘get_voltage(‘CH1’)’ on the API server, and display the result.

When this script is run on the API server, it returns a JSON object with the following structure:

{"Date": "Tue, 01 Aug 2017 21:39:12 GMT", "Filename": "example.py", "Id": 4,
 "result": [  {"type":"button","name":"button-id0","label":"get_voltage","fetched_value":"","action":{"type":"POST","endpoint":"get_voltage('CH1')","success":{"datapoint":'result',"type":"display_number", "target":"button-id0-label"}}},
  {"name": "button-id0label", "type": "label", "value": ""},
  ],
"status": true}

The above JSON object is parsed by the webapp’s user-home template, and a corresponding button and label are generated. The following section of code from user-home.hbs renders the JSON object

{{#each codeResults as |element|}}
  {{#if (eq element.type 'label')}}
    <label  id="{{element.name}}" class="{{element.class}}">{{element.value}}</label>
  {{/if}}
  {{#if (eq element.type 'button')}}
    <button id="{{element.name}}" {{action 'runButtonAction' element.action}}>{{element.label}}</button>
  {{/if}}
{{/each}}    

An action was also associated with the the created button, and this is the “get_voltage(‘CH1’)” string which we had specified in our one line script.

For the concluding section, we shall see how this action is invoked when the button is clicked, and how the returned value is used to update the contents of the label that was generated as part of this button.

Action defined in controllers/user-home.js :

runButtonAction(actionDefinition) {
  if(actionDefinition.type === 'POST') {
    Ember.$.post('/evalFunctionString',{'function':actionDefinition.endpoint},this,"json")
      .then(response => {
        const resultValue = Ember.get(response, actionDefinition.success.datapoint);
        if (actionDefinition.success.type === 'display_number') {
           Ember.$('#' + actionDefinition.success.target).text(resultValue.toFixed(3));
        }
      });
  }
}

The action string is passed to the evalFunctionString endpoint of the API, and the contents are mapped to the display label.

Screencast of the above process
Resources:
Continue ReadingEnhancing the Functionality of User Submitted Scripts in the PSLab-remote framework